Durango Bill's
Inflation -What causes it and where we're going
Zugzwang?
It’s the Fed’s turn to move – pick either side
(Hint – If a “Zugzwang” condition exists, any move results in disaster.)

There are positions in chess
where your current position appears to be safe, but if it’s
your turn to move (or make a decision), anything you do (or
don’t do) is going to result in disaster. The economy in the
U. S. appears to be in such a situation now. (This webpage was
originally posted in Aug. 2022.)
“Inflation is caused when the money supply in an economy grows at a faster rate than the economy’s ability to produce goods and services.”
Federal Reserve Bank of St. Louis
Milton Friedman famously said: “Inflation is always and everywhere a monetary phenomenon, in the sense that it is and can be produced only by a more rapid increase in the quantity of money than in output.” Of course, we all know the driver of the quantity of money is government spending priorities, and recently the government has been spending a lot. And this quote comes from decades ago.
“Milton Friedman was an American economist and statistician who received the 1976 Nobel Memorial Prize in Economic Sciences for his research on consumption analysis, monetary history and theory and the complexity of stabilization policy.” https://en.wikipedia.org/wiki/Milton_Friedman
Milton Friedman was also the author of There's “No Such Thing As a Free Lunch”.
Since “Inflation is caused when the money supply in an economy grows at faster rate than the economy’s ability to produce goods and services.”, let’s look at the evidence.
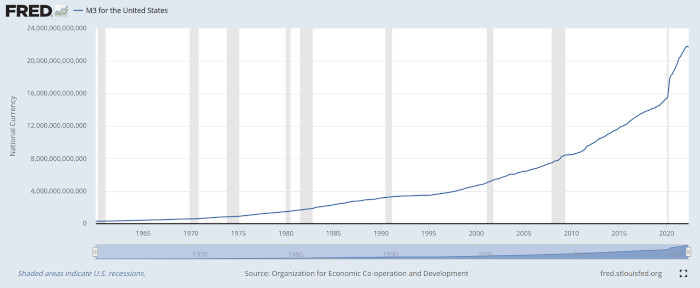
The chart above was produced by the Federal Reserve Bank of St. Louis. The chart shows the historical M3 Money Supply. https://fred.stlouisfed.org/series/MABMM301USM189S (There are several different categories of money supply, but the M3 version has been the broadest, most inclusive measurement.) The chart shows an ever increasing amount of available money with accelerating growth in recent years, capped off by a surge that was generated to offset COVID’s effect on the economy.
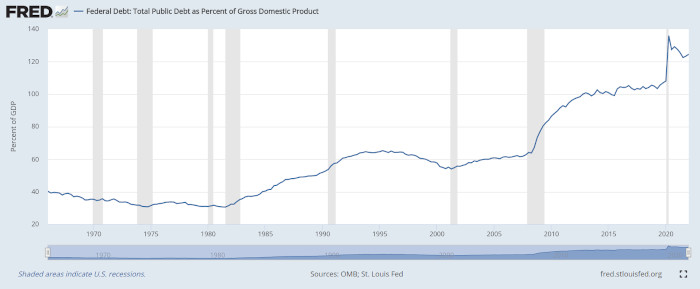
The chart above shows “Federal Debt: Total Public Debt as Percent of Gross Domestic Product”.
A second way of looking at "What got us into this mess in the first place" is to examine the annual compound growth rate in debt per year for each of the last 7 presidents.
Total Fed. Debt Compound Annual %
President Party Dates (in $ Mil,) Rate of Increase
-------------------------------------------------------------------------
Ronald Regan R Jan. 20, 1981 964,531
Jan. 20, 1989 2,740,898 13.95 %
George H. W. R Jan. 20, 1989 2,740,898
Bush Jan. 20, 1993 4,230,580 11.46 %
Bill Clinton D Jan. 20, 1993 4,230,580
Jan. 20, 2001 5,773,740 3.96 %
George W. Bush R Jan. 20, 2001 5,773,740
Jan. 20, 2009 11,126,941 8.55 %
Barack Obama D Jan. 20, 2009 11,126,941
Jan. 20, 2017 19,846,420 7.50 %
Donald Trump R Jan. 20, 2017 19,846,420
Jan. 20, 2021 28,132,570 9.11 %
Joe Biden D Jan. 20, 2021 28,132,570
(thru Dec. 31, 2022) 31,419,689 6.52 %
Fed. Debt: U.S. Department of the Treasury. Fiscal Service / St. Louis Federal Reserve Bank
Fed. debt amounts are as of the end of the first quarter for the relevant year.
If you wish, you can subdivide the above table into which political party was responsible for the 4 largest rates of increase vs. the political party that had the 3 smallest rates of increase.
There are 2 things that are irresistible to politicians regardless of what political party they belong to, regardless of which country they are in, and regardless of when in history they are living.
“1)” is relatively harmless.
Number “2)” if carried too far can destroy a country’s currency – which is synonymous with destroying the country itself.
The “Federal Debt: Total Public Debt as Percent of Gross Domestic Product” chart gives a 50+ year history of the ratio of United States federal debt to Gross Domestic Product. (Similar debt conditions usually prevail for corporate and private debt.) If this ratio is under 40%, history shows that the debt is manageable. During times of ordinary economic expansion it should be easy to pare down previous debt – and note, failure to do so leads to trouble. The further you go above this level, the greater the instability factor increases in your economy.
Ratios of 50% to 65% should be avoided if possible, but if worse comes to worse, the situation can still be brought back under control. A responsible government could still slowly allow an economy to pay off the debt load and emerge unscathed.
If the debt load rises into the 75% to 90% range, it becomes debatable if the debt load can be serviced by your economy. (If you are lucky, “maybe” people can maintain their standard of living and still pay the interest on the debt, or maybe their standard of living will get hurt just a little bit.)
If the debt load rises above 100%, the interest on the debt load becomes unmanageable. If this happens, if the money supply is not increased rapidly, there won’t be enough money to maintain people’s standard of living. A major depression results. (For example the 1930s.) People lose their jobs, companies go broke, etc.
And it's not just federal debt that's involved.

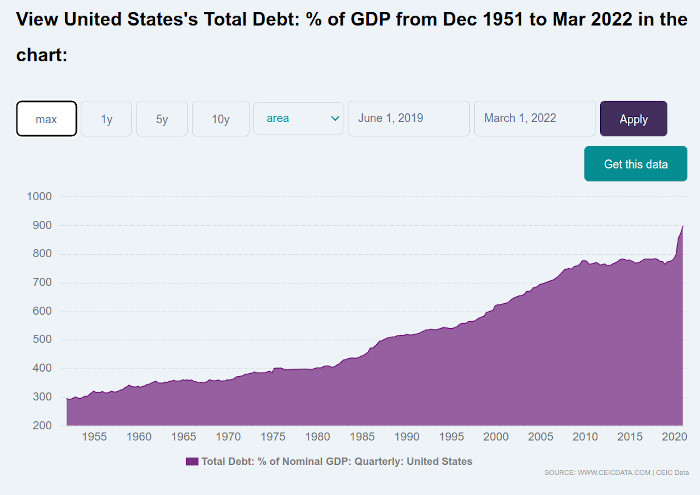
The chart above (courtesy of ceicdata ) shows the ratio of total debt (includes governmental, corporate, and private debt) to GDP. For decades the country as a whole has been borrowing money and going on an irrational spending spree.
The other possibility after instability conditions are created is to rapidly increase the money supply. This leads to accelerating run-away inflation. (Use wheelbarrows to carry enough money to buy groceries.) This doesn’t help the economy either as nobody can calculate what needs to be spent for raw materials that are needed to produce needed goods and services.
What causes inflation?
“Inflation is caused when the money supply in an economy grows at a faster rate than the economy’s ability to produce goods and services.”
Federal Reserve Bank of St. Louis
Milton Friedman famously said: “Inflation is always and everywhere a monetary phenomenon, in the sense that it is and can be produced only by a more rapid increase in the quantity of money than in output.” Of course, we all know the driver of the quantity of money is government spending priorities, and recently the government has been spending a lot. And this quote comes from decades ago.
“Milton Friedman was an American economist and statistician who received the 1976 Nobel Memorial Prize in Economic Sciences for his research on consumption analysis, monetary history and theory and the complexity of stabilization policy.” https://en.wikipedia.org/wiki/Milton_Friedman
Milton Friedman was also the author of There's “No Such Thing As a Free Lunch”.
So what is
causing the inflation that is bedeviling the U. S. in 2022
and where do we go from here?
Since “Inflation is caused when the money supply in an economy grows at faster rate than the economy’s ability to produce goods and services.”, let’s look at the evidence.
Click on the above picture for a large
version
The chart above was produced by the Federal Reserve Bank of St. Louis. The chart shows the historical M3 Money Supply. https://fred.stlouisfed.org/series/MABMM301USM189S (There are several different categories of money supply, but the M3 version has been the broadest, most inclusive measurement.) The chart shows an ever increasing amount of available money with accelerating growth in recent years, capped off by a surge that was generated to offset COVID’s effect on the economy.
What got us into this mess
in the first place?
and
Where do we go from here?
and
Where do we go from here?
Click on the above picture for a large
version
The chart above shows “Federal Debt: Total Public Debt as Percent of Gross Domestic Product”.
A second way of looking at "What got us into this mess in the first place" is to examine the annual compound growth rate in debt per year for each of the last 7 presidents.
Total Fed. Debt Compound Annual %
President Party Dates (in $ Mil,) Rate of Increase
-------------------------------------------------------------------------
Ronald Regan R Jan. 20, 1981 964,531
Jan. 20, 1989 2,740,898 13.95 %
George H. W. R Jan. 20, 1989 2,740,898
Bush Jan. 20, 1993 4,230,580 11.46 %
Bill Clinton D Jan. 20, 1993 4,230,580
Jan. 20, 2001 5,773,740 3.96 %
George W. Bush R Jan. 20, 2001 5,773,740
Jan. 20, 2009 11,126,941 8.55 %
Barack Obama D Jan. 20, 2009 11,126,941
Jan. 20, 2017 19,846,420 7.50 %
Donald Trump R Jan. 20, 2017 19,846,420
Jan. 20, 2021 28,132,570 9.11 %
Joe Biden D Jan. 20, 2021 28,132,570
(thru Dec. 31, 2022) 31,419,689 6.52 %
Fed. Debt: U.S. Department of the Treasury. Fiscal Service / St. Louis Federal Reserve Bank
Fed. debt amounts are as of the end of the first quarter for the relevant year.
If you wish, you can subdivide the above table into which political party was responsible for the 4 largest rates of increase vs. the political party that had the 3 smallest rates of increase.
There are 2 things that are irresistible to politicians regardless of what political party they belong to, regardless of which country they are in, and regardless of when in history they are living.
1) Get your face in front of a camera.
2) Spend other people’s money. (And especially, money that people haven’t received yet. Just “borrow” it from their future money.) Then invent a “reason” why this particular form of spending is good for the average person.
“1)” is relatively harmless.
Number “2)” if carried too far can destroy a country’s currency – which is synonymous with destroying the country itself.
The “Federal Debt: Total Public Debt as Percent of Gross Domestic Product” chart gives a 50+ year history of the ratio of United States federal debt to Gross Domestic Product. (Similar debt conditions usually prevail for corporate and private debt.) If this ratio is under 40%, history shows that the debt is manageable. During times of ordinary economic expansion it should be easy to pare down previous debt – and note, failure to do so leads to trouble. The further you go above this level, the greater the instability factor increases in your economy.
Ratios of 50% to 65% should be avoided if possible, but if worse comes to worse, the situation can still be brought back under control. A responsible government could still slowly allow an economy to pay off the debt load and emerge unscathed.
If the debt load rises into the 75% to 90% range, it becomes debatable if the debt load can be serviced by your economy. (If you are lucky, “maybe” people can maintain their standard of living and still pay the interest on the debt, or maybe their standard of living will get hurt just a little bit.)
If the debt load rises above 100%, the interest on the debt load becomes unmanageable. If this happens, if the money supply is not increased rapidly, there won’t be enough money to maintain people’s standard of living. A major depression results. (For example the 1930s.) People lose their jobs, companies go broke, etc.
And it's not just federal debt that's involved.

The chart above (courtesy of ceicdata ) shows the ratio of total debt (includes governmental, corporate, and private debt) to GDP. For decades the country as a whole has been borrowing money and going on an irrational spending spree.
The other possibility after instability conditions are created is to rapidly increase the money supply. This leads to accelerating run-away inflation. (Use wheelbarrows to carry enough money to buy groceries.) This doesn’t help the economy either as nobody can calculate what needs to be spent for raw materials that are needed to produce needed goods and services.
If your economy is already
unstable due to your debt structure, trying to hit a middle
ground (a soft landing) will probably produce both adverse
outcomes. (Run-away inflation and large scale
unemployment/bankruptcies)
The Federal Reserve Board has the power to control the money supply.
It’s the Fed’s turn to move – pick either side.
Zugzwang?
Return Durango Bill's home page
Web page generated via Sea Monkey's Composer
within a Linux Cinnamon Mint 20 operating system.
(Goodbye Microsoft)

