
Durango Bill's
Applied Mathematics
Mega Millions Odds
How to Calculate the Odds and Probabilities for the
Mega Millions Lottery - 70/24 Game Version
Starting with the April 8, 2025 game
Updated
for the game starting with the April 8, 2025 drawing. The
new game picks 5 balls out of 70 and one ball out of 24 for
a $5 ticket.
Note:
See http://www.durangobill.com/OldMegaMillionsOdds.html for the version of the game that was valid before April, 2025.
Game Rules
In the new April 2025 version, the price of a ticket has been increased to $5 from $2. The numbers picked for the prizes consist of 5 numbers picked at random from a pool of 70 numbers (the White Numbers). Then a single number (the Mega Number) is picked from a second pool that has 24 numbers. If the results of these random number selections match one of the winning combinations on your lottery ticket, then you win something.
Cash Value of a Game
If you win the Jackpot, you have the option of either accepting 30 annuity payments (A cash amount that is paid annually), or you can take a lump sum "cash value" payment. If you take the annuity, you will get a series of payments that will increase at 5% per year. The total of these 30 payments will approximately equal the advertised size of the Jackpot. (This assumes you are a single winner and not sharing the Jackpot with someone else. Taxes will subsequently be subtracted/withheld from these payments.)
If you take an immediate cash payment instead of the 30 year annuity, you will get about one half (before taxes) of the advertised "annuity" value of the game. Lower interest rates will increase this fraction while higher interest rates will decrease the cash payout.
The following table shows the relative amounts that you would receive given various interest rates. For the calculations below, an advertised "annuity" value for the Jackpot of $100,000,000 is assumed. (The $100,000,000 could be your share of a shared Jackpot.) The amounts in the table can be directly scaled for any arbitrary Jackpot size.
(All amounts are BEFORE taxes.)
(All results rounded to the nearest $1)
Note that the cash value of the Jackpot is normally about one half of the advertised value of the Jackpot. For the rest of this web page, we will just refer to these exact values as "about one half" instead of the above exact values.
As an example of scaling for different sized Jackpots, if the (current) interest rate is 4% and the advertised annuity Jackpot is $300,000,000, then multiply the results in the 4% row by 3 to get the corresponding instant cash payout amount or annual annuity payout amounts.
Combinatorics Calculations
In any combinatorics problem where all possible outcomes are equally likely, the probability of a successful outcome is determined by finding the number of successful combinations, and then dividing by the total number of all combinations. There are nine possible configurations that will win something in the Mega Millions Lottery. For each of these, the probability of winning equals the number of winning combinations for that particular configuration divided by the total number of ways the Mega Millions numbers can be picked.
Mega Millions Total Combinations
Since the total number of combinations for Mega Millions numbers is used in all the calculations, we will calculate it first. The number of ways 5 numbers can be randomly selected from a field of 70 is: COMBIN(70,5) = 12,103,014. (See the math notation page or Help in Microsoft's Excel for more information on “COMBIN”).
For each of these 12,103,014 combinations there are COMBIN(24,1) = 24 different ways to pick the sixth number (the “Mega” number). The total number of ways to pick the 6 numbers is the product of these two partial calculations. Thus, the total number of equally likely Mega Millions combinations is 12,103,014 x 24 = 290,472,336. We will use this number for each of the following calculations.
Jackpot probability/odds (Payout varies)
The number of ways the first 5 numbers on your lottery ticket can match the 5 White numbers is COMBIN(5,5) = 1. The number of ways your final number can match the Mega number is: COMBIN(1,1) = 1. The product of these is the number of ways you can win the Jackpot: COMBIN(5,5) x COMBIN(1,1) = 1. The probability of success is thus: 1/290,472,336 = 0.000000003443. If you express this as “One chance in ???”, you just divide “1” by the 0.000000003443, which yields “One chance in 290,472,336”.
For all subsequent combinations calculations (not including the Jackpot) we will use the weighted average for the multiplier.
(Weighted average for the multiplier = 3.00 = 2nd number in the Megs Millions company's examples).
Match all 5 White numbers but not the Mega number (Payout = about $3,000,000)
The number of ways the 5 first numbers on your lottery ticket can match the 5 White numbers is COMBIN(5,5) = 1. The number of ways your final number can match any of the 23 losing Mega numbers is: COMBIN(23,1) - 1 = 23. (Pick any of the 23 losers.) Thus there are COMBIN(5,5) x (COMBIN(23,1) = 23 possible combinations. The probability for winning $3,000,000 is thus 23/290,472,336 = .00000007918 or “One chance in 12,629,232”.
Match 4 out of 5 White numbers and match the Mega number (Payout = about $30,000)
The number of ways 4 of the 5 first numbers on your lottery ticket can match the 5 White numbers is COMBIN(5,4) = 5. The number of ways your fifth initial number can match any of the 65 losing White numbers is COMBIN(65,1) = 65. The number of ways your final number can match the Mega number is: COMBIN(1,1) = 1. The product of these is the number of ways you can get this configuration: COMBIN(5,4) x COMBIN(65,1) x COMBIN(1,1) = 325. The probability of success is thus: 325/290,472,336 = 0.000001119 or “One chance in 893,761.03”.
Match 4 out of 5 White numbers but not match the Mega number (Payout = about $1,500)
The number of ways 4 of the 5 first numbers on your lottery ticket can match the 5 White numbers is COMBIN(5,4) = 5. The number of ways your fifth initial number can match any of the 65 losing White numbers is COMBIN(65,1) = 65. The number of ways your final number can match any of the 23 losing Mega numbers is: COMBIN(23,1) = 23. The product of these is the number of ways you can get this configuration: COMBIN(5,4) x COMBIN(65,1) x COMBIN(23,1) = 7,475. The probability of success is thus: 7,475/290,472,336 = 0.00002573 or “One chance in 38,859.18”.
Match 3 out of 5 White numbers and match the Mega number (Payout = about $600)
The number of ways 3 of the 5 first numbers on your lottery ticket can match the 5 White numbers is COMBIN(5,3) = 10. The number of ways the 2 losing initial numbers on your ticket can match any of the 65 losing White numbers is COMBIN(65,2) = 2,080. The number of ways your final number can match the Mega number is: COMBIN(1,1) = 1. The product of these is the number of ways you can get this configuration: COMBIN(5,3) x COMBIN(65,2) x COMBIN(1,1) = 20,800. The probability of success is thus: 20,800/290,472,336= 0.00007161 or One chance in 13,965.02”.
Match 3 out of 5 White numbers but not match the Mega number (Payout = about $30)
The number of ways 3 of the 5 first numbers on your lottery ticket can match the 5 White numbers is COMBIN(5,3) = 10. The number of ways the 2 losing initial numbers on your ticket can match any of the 65 losing White numbers is COMBIN(65,2) = 2,080. The number of ways your final number can match any of the 23 losing Mega numbers is: COMBIN(23,1) -1= 23. The product of these is the number of ways you can get this configuration: COMBIN(5,3) x COMBIN(65,2) x COMBIN(23,1) = 478,400. The probability of success is thus: 478,400/290,472,336” = 0.001647 or “One chance in 607.17”.
Match 2 out of 5 White numbers and match the Mega number (Payout = about $30)
The number of ways 2 of the 5 first numbers on your lottery ticket can match the 5 White numbers is COMBIN(5,2) = 10. The number of ways the 3 losing initial numbers on your ticket can match any of the 65 losing White numbers is COMBIN(65,3) = 43,680. The number of ways your final number can match the Mega number is: COMBIN(1,1) = 1. The product of these is the number of ways you can get this configuration: COMBIN(5,2) x COMBIN(65,3) x COMBIN(1,1) = 436,800. The probability of success is thus: 436,800/290,472,336” = 0.001504 or “One chance in 665.00”.
Match 1 out of 5 White numbers and match the Mega number (Payout = $21)
The number of ways 1 of the 5 first numbers on your lottery ticket can match the 5 White numbers is COMBIN(5,1) = 5. The number of ways the 4 losing initial numbers on your ticket can match any of the 65 losing White numbers is COMBIN(65,4) = 677,040. The number of ways your final number can match the Mega number is: COMBIN(1,1) = 1. The product of these is the number of ways you can get this configuration: COMBIN(5,1) x COMBIN(65,4) x COMBIN(1,1) = 3,385,200. The probability of success is thus: 3,385,200/290,472,336” = 0.01165 or “One chance in 85.81”.
Match 0 out of 5 White numbers and match the Mega number (Payout = $15)
The number of ways 0 of the 5 first numbers on your lottery ticket can match the 5 White numbers is COMBIN(5,0) = 1. The number of ways the 5 losing initial numbers on your ticket can match any of the 65 losing White numbers is COMBIN(65,5) = 8,259,888. The number of ways your final number can match the Mega number is: COMBIN(1,1) = 1. The product of these is the number of ways you can get this configuration: COMBIN(5,0) x COMBIN(65,5) x COMBIN(1,1) = 8,259,888. The probability of success is thus: 8,259,888/290,472,336” = 0.02844 or “One chance in 35.17”.
Probability of winning something
If we add all the ways you can win something we get:
1 + 23 + 325 + 7,475 + 20,800 + 478400 + 436,800 + 3,385,200 + 8,259,888 = 12,588,912 different ways of winning something. If we divide the result by the 290,472,336”, we get .04334 as a probability of winning something. 1 divided by 0.04334 yields “One chance in 23.07” of winning something. Alternately, the probability of not winning anything is 1 - .04334 = 0.9567 which is about 22 out of every 23 tickets.
Probability of not matching anything
Match 0 out of 5 white numbers and not match the Mega Number
There are 290,472,336” possible outcomes to the game, Of these (as noted above) there are 1 + 23 + 325 + 7,475 + 20,800 + 478,400 + 436,800 + 3,385,200 + 8,259,888 = 12,588.912 ways of winning something - which leaves 290,472,336 - 12,588,9128 = 277,883,424 ways of not winning anything. The probability that a random ticket will not win anything is 277,883,424/290,472,336 =0.9567 or about 22 out of 23 times your Mega Millions ticket will not win anything.
Note: This web page had over 50,000 hits for the large Jackpot on Jan. 4, 2011. If this is representative of what happened at Mega Millions headquarters, I extend my deepest sympathy to their computers.
Note: All calculations assume that the numbers on any given ticket are picked randomly. In practice, many people pick numbers based on family birthdays, etc., and thus many tickets will have a preponderance of low numbers. As a consequence, the probabilities of a single Jackpot winner will be somewhat lower and the probabilities of no winner or multiple winners will tend to be slightly higher than the numbers shown below. Also if the numbers picked in the drawing are clustered at the high end of the 1-70 range, there will tend to be relatively less “partial match” winners. The reverse will hold true if the drawing numbers cluster in the low end of the number range.
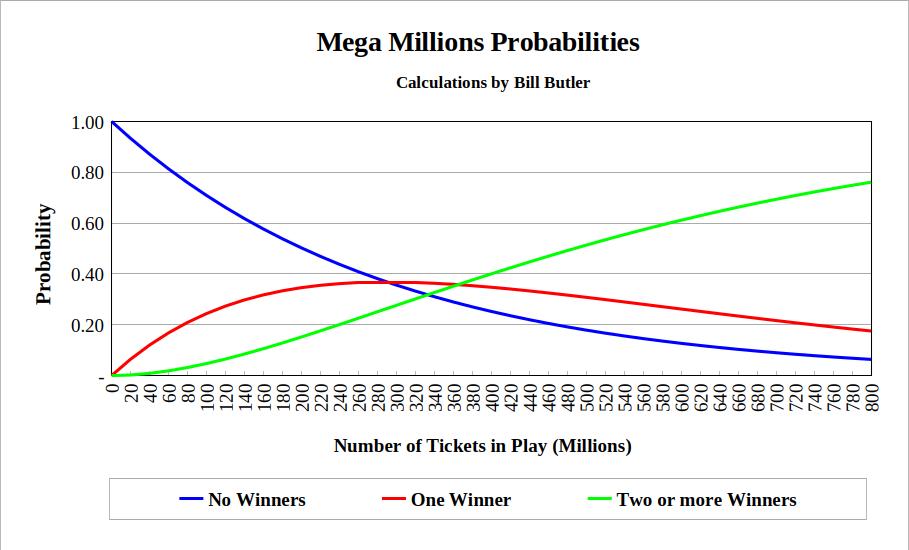
The above chart shows the probabilities of “No Winners”, “One Winner”, and “Two or more Winners” for various numbers of tickets in play.
Each entry in the following table shows the probability of “K” tickets holding the same winning Jackpot combination given that "N" tickets are in play for a given Mega Millions game. It is assumed that the number selections on each ticket are picked randomly. For example: If 200,000,000 tickets are in play for a Mega Millions game, then there is a 0.1191 probability that exactly two of these tickets will have the same winning combination.
Note: You can get a rough estimate of the number of tickets in play as follows. If the preceding Mega Millions game had no Jackpot winner, then find the difference in the annuity Jackpot amount for the prior game vs. the current annuity Jackpot amount. The number of tickets in play is approximately three tenths (0.30) of this number. (Technically, this "3/10" is variable. If interest rates are low, the ratio will be greater than 3/10. And vice versa, if interest rates are high, the ratio will be less than 3/0.)
For example, if the preceding game had an advertised annuity payout amount of $200,000,000 and the current game has an advertised annuity payout amount of $280,000,000, then there are about (280,000,000 - 200,000,000) x 0.30 = 80,000,000 x 0.30 = 240,000,000 tickets in play for the current game. (Past Jackpot amounts can be seen at: http://www.lottoreport.com/ticketcomparison.htm The cash payout value for these lottoreport numbers would be about one-half the announced Jackpot annuity amount.)
The table below shows the probabilities for 0 to 6 jackpot winners for various numbers of tickets in play. The graph above is derived from a larger version of this table.
“N” Number “K”
of tickets Number of tickets holding the Jackpot combination
in play 0 1 2 3 4 5 6
----------------------------------------------------------------------
100,000,000 0.7087 0.2440 0.0420 0.0048 0.0004 0.0000 0.0000
200,000,000 0.5023 0.3459 0.1191 0.0273 0.0047 0.0006 0.0001
300,000,000 0.3560 0.3677 0.1899 0.0654 0.0169 0.0035 0.0006
400,000,000 0.2523 0.3475 0.2392 0.1098 0.0378 0.0104 0.0024
500,000,000 0.1788 0.3078 0.2649 0.1520 0.0654 0.0225 0.0065
Any entry in the table can be calculated using the following equation:
Prob. = COMBIN(N,K) x (Pwin^K) x (Pnotwin^(N-K))
Where:
N = Number of tickets in play = Number of tickets holding the Jackpot combination
Pwin = Probability that a random ticket will win ( = 1 / 290,472,336 = 0.000000003443)
Pnotwin = (1.0 - Pwin) = 0.999999996557
COMBIN(N,K) = number of ways to select K items from a group of N items
x = multiply terms
^ = raise to power (e.g. 2^3 = 8 )
To calculate what the expected cash value of your Mega Millions ticket might be worth, we first consider all the non Jackpot prizes, and then throw in an educated guess as to what the Jackpot would add to this. For the non Jackpot amounts, we simply multiply the weighted payoff for each payoff amount of each by it's expected probability, and then add all the results.
Winning Combination Prize Probability Product
------------------------------------------------------------------------------------
5 Wh. no Mega 3.000,000 .00000007918 .2375
4 Wh. + Mega 30.000 .000001119 .02375
4 Wh. no Mega 1.500 .00002573 .0336
3 Wh. + Mega 600 .00007161 .0430
3 Wh. no Mega 30 .001647 .0494
2 Wh. + Mega 30 .002844 .0451
1 Wh. + Mega 21 .01165 .2447
0 Wh. + Mega 15 .02844 .4265
--------
Total $ 1.1185
Amounts use the weighed multiplier which is 3.00. Thus for your $5,00 ticket, your expected return for the non Jackpot prizes is $1.1185 before any taxes that night be due.
The optimal Jackpot return (for a single lone ticket) is the cash value of the Jackpot multiplied by the probability of winning it. For a $400,000,000 cash jackpot this would be 400,000,000 x 0 .000000003443 = $1.3771 which when added to your previously non Jackpot total of $1.1185 gives you $2.4956 in return for your $5.00 ticket. Expected Jackpot returns gradually become less when more than one ticket is in play, because any increase in the number of tickets in play increases the chances that you will have to split the Jackpot with some else. Then of course you will have to pay taxes on any proceeds which further reduces the after tax money that you can keep.
2nd Thoughts
The 2015 fatality rate per 100 million Vehicle Miles Traveled in the U.S. was 1.12. https://crashstats.nhtsa.dot.gov/Api/Public/ViewPublication/812318 . If you drive one mile to the store to buy your Mega Millions ticket and then return home, you have driven two miles. Thus the probability that you will join this statistical group is 2 x 1.12 / 100,000,000 = 0.0000000224 fatalities per vehicle mile. This can also be stated as “One chance in 44,642,857”. Thus, if you drive one mile to (and return from) the store to buy your Mega Million ticket, your chance of being killed (or killing someone else) is nearly 7 times greater than the chance that you will win the Mega Millions Jackpot.
Alternately, if you “played” Russian Roulette 100 times per day, every day for 79 years, with Mega Millions Jackpot odds, you would have better than a 99% chance of surviving.
3rd Thoughts
A lottery is a “Zero-sum game”. What one group of participants gains in cash, the other group of participants must lose. If we made a list of all the participants in a lottery, it might include:
1) Federal Government (Lottery winnings are taxable)
2) State Governments (Again lottery winnings are taxable)
3) State Governments (Direct share of lottery ticket sales)
4) Merchants that sell tickets (Paid by the lottery organizers)
5) Lottery companies (Hint: They are not doing all this for free)
6) Advertisers and promoters (Paid by the lottery companies)
7) Lottery ticket buyers (Buy lottery tickets and receive payouts)
The winners in the above list are:
1) Federal Government
2) State Government (Taxes)
3) State Government (Direct share)
4) Merchants that sell tickets
5) Lottery companies
6) Advertisers and promoters
And the losers are:
(Mathematically challenged and proud of it)
Also please see the related calculations for Powerball.
Return to Durango Bill's Home page.
Web page generated via Sea Monkey's Composer HTML editor
within a Linux Cinnamon Mint 18 operating system.
(Goodbye Microsoft)
Note:
See http://www.durangobill.com/OldMegaMillionsOdds.html for the version of the game that was valid before April, 2025.
Concise Table of Mega Millions Odds
(Mathematical derivation below)
(Mathematical derivation below)
Ticket Matches Payout Odds Probability
---------------------------------------------------------------------
5 White + Mega Jackpot 1 in 290,472,336.00 0.000000003443
5 White No Mega 3,000,000 1 in 12,629,232.00 0.00000007918
4 White + Mega 30,000 1 in 893,761.03 0.000001119
4 White No Mega 1,500 1 in 38,859.18 0.00002573
3 White + Mega 600 1 in 13,965.02 0.00007161
3 White No Mega 30 1 in 607.17 0.001647
2 White + Mega 30 1 in 665.00 0.001504
1 White + Mega 21 1 in 85.81 0.01165
0 White + Mega 15 1 in 35.17 0.02844
Win something Variable 1 in 23.07 0.04334
All lines except the jackpot include/use the weighted average of the multiplier.
Game Rules
In the new April 2025 version, the price of a ticket has been increased to $5 from $2. The numbers picked for the prizes consist of 5 numbers picked at random from a pool of 70 numbers (the White Numbers). Then a single number (the Mega Number) is picked from a second pool that has 24 numbers. If the results of these random number selections match one of the winning combinations on your lottery ticket, then you win something.
Cash Value of a Game
If you win the Jackpot, you have the option of either accepting 30 annuity payments (A cash amount that is paid annually), or you can take a lump sum "cash value" payment. If you take the annuity, you will get a series of payments that will increase at 5% per year. The total of these 30 payments will approximately equal the advertised size of the Jackpot. (This assumes you are a single winner and not sharing the Jackpot with someone else. Taxes will subsequently be subtracted/withheld from these payments.)
If you take an immediate cash payment instead of the 30 year annuity, you will get about one half (before taxes) of the advertised "annuity" value of the game. Lower interest rates will increase this fraction while higher interest rates will decrease the cash payout.
The following table shows the relative amounts that you would receive given various interest rates. For the calculations below, an advertised "annuity" value for the Jackpot of $100,000,000 is assumed. (The $100,000,000 could be your share of a shared Jackpot.) The amounts in the table can be directly scaled for any arbitrary Jackpot size.
(All amounts are BEFORE taxes.)
Interest Immediate First Payment Last Payment
Rate Cash Payout If Take Annuity If Take Annuity
3.0% $60,506,809 $1,505,144 $6,195,375
3.5% 56,062,409 1,505,144 6,195,375
4.0% 52,053,422 1,505,144 6,195,375
4.5% 48,431,551 1,505,144 6,195,375
5.0% 45,154,305 1,505,144 6,195,375
6.0% 39,488,405 1,505,144 6,195,375
8.0% 30,912,469 1,505,144 6,195,375
(All results rounded to the nearest $1)
Note that the cash value of the Jackpot is normally about one half of the advertised value of the Jackpot. For the rest of this web page, we will just refer to these exact values as "about one half" instead of the above exact values.
As an example of scaling for different sized Jackpots, if the (current) interest rate is 4% and the advertised annuity Jackpot is $300,000,000, then multiply the results in the 4% row by 3 to get the corresponding instant cash payout amount or annual annuity payout amounts.
Combinatorics Calculations
In any combinatorics problem where all possible outcomes are equally likely, the probability of a successful outcome is determined by finding the number of successful combinations, and then dividing by the total number of all combinations. There are nine possible configurations that will win something in the Mega Millions Lottery. For each of these, the probability of winning equals the number of winning combinations for that particular configuration divided by the total number of ways the Mega Millions numbers can be picked.
Mega Millions Total Combinations
Since the total number of combinations for Mega Millions numbers is used in all the calculations, we will calculate it first. The number of ways 5 numbers can be randomly selected from a field of 70 is: COMBIN(70,5) = 12,103,014. (See the math notation page or Help in Microsoft's Excel for more information on “COMBIN”).
For each of these 12,103,014 combinations there are COMBIN(24,1) = 24 different ways to pick the sixth number (the “Mega” number). The total number of ways to pick the 6 numbers is the product of these two partial calculations. Thus, the total number of equally likely Mega Millions combinations is 12,103,014 x 24 = 290,472,336. We will use this number for each of the following calculations.
Jackpot probability/odds (Payout varies)
The number of ways the first 5 numbers on your lottery ticket can match the 5 White numbers is COMBIN(5,5) = 1. The number of ways your final number can match the Mega number is: COMBIN(1,1) = 1. The product of these is the number of ways you can win the Jackpot: COMBIN(5,5) x COMBIN(1,1) = 1. The probability of success is thus: 1/290,472,336 = 0.000000003443. If you express this as “One chance in ???”, you just divide “1” by the 0.000000003443, which yields “One chance in 290,472,336”.
For all subsequent combinations calculations (not including the Jackpot) we will use the weighted average for the multiplier.
(Weighted average for the multiplier = 3.00 = 2nd number in the Megs Millions company's examples).
Match all 5 White numbers but not the Mega number (Payout = about $3,000,000)
The number of ways the 5 first numbers on your lottery ticket can match the 5 White numbers is COMBIN(5,5) = 1. The number of ways your final number can match any of the 23 losing Mega numbers is: COMBIN(23,1) - 1 = 23. (Pick any of the 23 losers.) Thus there are COMBIN(5,5) x (COMBIN(23,1) = 23 possible combinations. The probability for winning $3,000,000 is thus 23/290,472,336 = .00000007918 or “One chance in 12,629,232”.
Match 4 out of 5 White numbers and match the Mega number (Payout = about $30,000)
The number of ways 4 of the 5 first numbers on your lottery ticket can match the 5 White numbers is COMBIN(5,4) = 5. The number of ways your fifth initial number can match any of the 65 losing White numbers is COMBIN(65,1) = 65. The number of ways your final number can match the Mega number is: COMBIN(1,1) = 1. The product of these is the number of ways you can get this configuration: COMBIN(5,4) x COMBIN(65,1) x COMBIN(1,1) = 325. The probability of success is thus: 325/290,472,336 = 0.000001119 or “One chance in 893,761.03”.
Match 4 out of 5 White numbers but not match the Mega number (Payout = about $1,500)
The number of ways 4 of the 5 first numbers on your lottery ticket can match the 5 White numbers is COMBIN(5,4) = 5. The number of ways your fifth initial number can match any of the 65 losing White numbers is COMBIN(65,1) = 65. The number of ways your final number can match any of the 23 losing Mega numbers is: COMBIN(23,1) = 23. The product of these is the number of ways you can get this configuration: COMBIN(5,4) x COMBIN(65,1) x COMBIN(23,1) = 7,475. The probability of success is thus: 7,475/290,472,336 = 0.00002573 or “One chance in 38,859.18”.
Match 3 out of 5 White numbers and match the Mega number (Payout = about $600)
The number of ways 3 of the 5 first numbers on your lottery ticket can match the 5 White numbers is COMBIN(5,3) = 10. The number of ways the 2 losing initial numbers on your ticket can match any of the 65 losing White numbers is COMBIN(65,2) = 2,080. The number of ways your final number can match the Mega number is: COMBIN(1,1) = 1. The product of these is the number of ways you can get this configuration: COMBIN(5,3) x COMBIN(65,2) x COMBIN(1,1) = 20,800. The probability of success is thus: 20,800/290,472,336= 0.00007161 or One chance in 13,965.02”.
Match 3 out of 5 White numbers but not match the Mega number (Payout = about $30)
The number of ways 3 of the 5 first numbers on your lottery ticket can match the 5 White numbers is COMBIN(5,3) = 10. The number of ways the 2 losing initial numbers on your ticket can match any of the 65 losing White numbers is COMBIN(65,2) = 2,080. The number of ways your final number can match any of the 23 losing Mega numbers is: COMBIN(23,1) -1= 23. The product of these is the number of ways you can get this configuration: COMBIN(5,3) x COMBIN(65,2) x COMBIN(23,1) = 478,400. The probability of success is thus: 478,400/290,472,336” = 0.001647 or “One chance in 607.17”.
Match 2 out of 5 White numbers and match the Mega number (Payout = about $30)
The number of ways 2 of the 5 first numbers on your lottery ticket can match the 5 White numbers is COMBIN(5,2) = 10. The number of ways the 3 losing initial numbers on your ticket can match any of the 65 losing White numbers is COMBIN(65,3) = 43,680. The number of ways your final number can match the Mega number is: COMBIN(1,1) = 1. The product of these is the number of ways you can get this configuration: COMBIN(5,2) x COMBIN(65,3) x COMBIN(1,1) = 436,800. The probability of success is thus: 436,800/290,472,336” = 0.001504 or “One chance in 665.00”.
Match 1 out of 5 White numbers and match the Mega number (Payout = $21)
The number of ways 1 of the 5 first numbers on your lottery ticket can match the 5 White numbers is COMBIN(5,1) = 5. The number of ways the 4 losing initial numbers on your ticket can match any of the 65 losing White numbers is COMBIN(65,4) = 677,040. The number of ways your final number can match the Mega number is: COMBIN(1,1) = 1. The product of these is the number of ways you can get this configuration: COMBIN(5,1) x COMBIN(65,4) x COMBIN(1,1) = 3,385,200. The probability of success is thus: 3,385,200/290,472,336” = 0.01165 or “One chance in 85.81”.
Match 0 out of 5 White numbers and match the Mega number (Payout = $15)
The number of ways 0 of the 5 first numbers on your lottery ticket can match the 5 White numbers is COMBIN(5,0) = 1. The number of ways the 5 losing initial numbers on your ticket can match any of the 65 losing White numbers is COMBIN(65,5) = 8,259,888. The number of ways your final number can match the Mega number is: COMBIN(1,1) = 1. The product of these is the number of ways you can get this configuration: COMBIN(5,0) x COMBIN(65,5) x COMBIN(1,1) = 8,259,888. The probability of success is thus: 8,259,888/290,472,336” = 0.02844 or “One chance in 35.17”.
Probability of winning something
If we add all the ways you can win something we get:
1 + 23 + 325 + 7,475 + 20,800 + 478400 + 436,800 + 3,385,200 + 8,259,888 = 12,588,912 different ways of winning something. If we divide the result by the 290,472,336”, we get .04334 as a probability of winning something. 1 divided by 0.04334 yields “One chance in 23.07” of winning something. Alternately, the probability of not winning anything is 1 - .04334 = 0.9567 which is about 22 out of every 23 tickets.
Probability of not matching anything
Match 0 out of 5 white numbers and not match the Mega Number
There are 290,472,336” possible outcomes to the game, Of these (as noted above) there are 1 + 23 + 325 + 7,475 + 20,800 + 478,400 + 436,800 + 3,385,200 + 8,259,888 = 12,588.912 ways of winning something - which leaves 290,472,336 - 12,588,9128 = 277,883,424 ways of not winning anything. The probability that a random ticket will not win anything is 277,883,424/290,472,336 =0.9567 or about 22 out of 23 times your Mega Millions ticket will not win anything.
Note: This web page had over 50,000 hits for the large Jackpot on Jan. 4, 2011. If this is representative of what happened at Mega Millions headquarters, I extend my deepest sympathy to their computers.
Probability of multiple
winning tickets (multiple winners)
given “N” tickets in play
given “N” tickets in play
Note: All calculations assume that the numbers on any given ticket are picked randomly. In practice, many people pick numbers based on family birthdays, etc., and thus many tickets will have a preponderance of low numbers. As a consequence, the probabilities of a single Jackpot winner will be somewhat lower and the probabilities of no winner or multiple winners will tend to be slightly higher than the numbers shown below. Also if the numbers picked in the drawing are clustered at the high end of the 1-70 range, there will tend to be relatively less “partial match” winners. The reverse will hold true if the drawing numbers cluster in the low end of the number range.
The above chart shows the probabilities of “No Winners”, “One Winner”, and “Two or more Winners” for various numbers of tickets in play.
Each entry in the following table shows the probability of “K” tickets holding the same winning Jackpot combination given that "N" tickets are in play for a given Mega Millions game. It is assumed that the number selections on each ticket are picked randomly. For example: If 200,000,000 tickets are in play for a Mega Millions game, then there is a 0.1191 probability that exactly two of these tickets will have the same winning combination.
Note: You can get a rough estimate of the number of tickets in play as follows. If the preceding Mega Millions game had no Jackpot winner, then find the difference in the annuity Jackpot amount for the prior game vs. the current annuity Jackpot amount. The number of tickets in play is approximately three tenths (0.30) of this number. (Technically, this "3/10" is variable. If interest rates are low, the ratio will be greater than 3/10. And vice versa, if interest rates are high, the ratio will be less than 3/0.)
For example, if the preceding game had an advertised annuity payout amount of $200,000,000 and the current game has an advertised annuity payout amount of $280,000,000, then there are about (280,000,000 - 200,000,000) x 0.30 = 80,000,000 x 0.30 = 240,000,000 tickets in play for the current game. (Past Jackpot amounts can be seen at: http://www.lottoreport.com/ticketcomparison.htm The cash payout value for these lottoreport numbers would be about one-half the announced Jackpot annuity amount.)
The table below shows the probabilities for 0 to 6 jackpot winners for various numbers of tickets in play. The graph above is derived from a larger version of this table.
“N” Number “K”
of tickets Number of tickets holding the Jackpot combination
in play 0 1 2 3 4 5 6
----------------------------------------------------------------------
100,000,000 0.7087 0.2440 0.0420 0.0048 0.0004 0.0000 0.0000
200,000,000 0.5023 0.3459 0.1191 0.0273 0.0047 0.0006 0.0001
300,000,000 0.3560 0.3677 0.1899 0.0654 0.0169 0.0035 0.0006
400,000,000 0.2523 0.3475 0.2392 0.1098 0.0378 0.0104 0.0024
500,000,000 0.1788 0.3078 0.2649 0.1520 0.0654 0.0225 0.0065
Any entry in the table can be calculated using the following equation:
Prob. = COMBIN(N,K) x (Pwin^K) x (Pnotwin^(N-K))
Where:
N = Number of tickets in play = Number of tickets holding the Jackpot combination
Pwin = Probability that a random ticket will win ( = 1 / 290,472,336 = 0.000000003443)
Pnotwin = (1.0 - Pwin) = 0.999999996557
COMBIN(N,K) = number of ways to select K items from a group of N items
x = multiply terms
^ = raise to power (e.g. 2^3 = 8 )
A Sample Calculation to Find the
Expected Cash Ticket Value
Considering the Number of Tickets That are in Play
Considering the Number of Tickets That are in Play
To calculate what the expected cash value of your Mega Millions ticket might be worth, we first consider all the non Jackpot prizes, and then throw in an educated guess as to what the Jackpot would add to this. For the non Jackpot amounts, we simply multiply the weighted payoff for each payoff amount of each by it's expected probability, and then add all the results.
Winning Combination Prize Probability Product
------------------------------------------------------------------------------------
5 Wh. no Mega 3.000,000 .00000007918 .2375
4 Wh. + Mega 30.000 .000001119 .02375
4 Wh. no Mega 1.500 .00002573 .0336
3 Wh. + Mega 600 .00007161 .0430
3 Wh. no Mega 30 .001647 .0494
2 Wh. + Mega 30 .002844 .0451
1 Wh. + Mega 21 .01165 .2447
0 Wh. + Mega 15 .02844 .4265
--------
Total $ 1.1185
Amounts use the weighed multiplier which is 3.00. Thus for your $5,00 ticket, your expected return for the non Jackpot prizes is $1.1185 before any taxes that night be due.
The optimal Jackpot return (for a single lone ticket) is the cash value of the Jackpot multiplied by the probability of winning it. For a $400,000,000 cash jackpot this would be 400,000,000 x 0 .000000003443 = $1.3771 which when added to your previously non Jackpot total of $1.1185 gives you $2.4956 in return for your $5.00 ticket. Expected Jackpot returns gradually become less when more than one ticket is in play, because any increase in the number of tickets in play increases the chances that you will have to split the Jackpot with some else. Then of course you will have to pay taxes on any proceeds which further reduces the after tax money that you can keep.
2nd Thoughts
The 2015 fatality rate per 100 million Vehicle Miles Traveled in the U.S. was 1.12. https://crashstats.nhtsa.dot.gov/Api/Public/ViewPublication/812318 . If you drive one mile to the store to buy your Mega Millions ticket and then return home, you have driven two miles. Thus the probability that you will join this statistical group is 2 x 1.12 / 100,000,000 = 0.0000000224 fatalities per vehicle mile. This can also be stated as “One chance in 44,642,857”. Thus, if you drive one mile to (and return from) the store to buy your Mega Million ticket, your chance of being killed (or killing someone else) is nearly 7 times greater than the chance that you will win the Mega Millions Jackpot.
Alternately, if you “played” Russian Roulette 100 times per day, every day for 79 years, with Mega Millions Jackpot odds, you would have better than a 99% chance of surviving.
3rd Thoughts
A lottery is a “Zero-sum game”. What one group of participants gains in cash, the other group of participants must lose. If we made a list of all the participants in a lottery, it might include:
1) Federal Government (Lottery winnings are taxable)
2) State Governments (Again lottery winnings are taxable)
3) State Governments (Direct share of lottery ticket sales)
4) Merchants that sell tickets (Paid by the lottery organizers)
5) Lottery companies (Hint: They are not doing all this for free)
6) Advertisers and promoters (Paid by the lottery companies)
7) Lottery ticket buyers (Buy lottery tickets and receive payouts)
The winners in the above list are:
1) Federal Government
2) State Government (Taxes)
3) State Government (Direct share)
4) Merchants that sell tickets
5) Lottery companies
6) Advertisers and promoters
And the losers are:
(Mathematically challenged and proud of it)
Also please see the related calculations for Powerball.
Return to Durango Bill's Home page.
Web page generated via Sea Monkey's Composer HTML editor
within a Linux Cinnamon Mint 18 operating system.
(Goodbye Microsoft)