Durango
Bill’s
Glaciology
Glaciology
The Taku Glacier
What it is and what is going to happen to it
(Originally posted Aug. 26, 2017 - with
subsequent updates/additions)
The Taku Glacier is the largest glacier draining the Juneau Icefield. The Juneau Icefield covers about 1,500 sq. miles of Alaska and British Columbia, and has dozens of major glaciers and at least 150 small glaciers. All of these have been retreating with the exception of the Taku. (And its distributary – the Hole-in-the-Wall Glacier) It appears that this anomaly of the Taku Glacier is about to end as the Taku appears to be going into retreat. The retreat is expected to accelerate rapidly with the retreat rate likely to become >= 500 feet per year within a few decades.
The following sections will examine:
1) The Taku Glacier and its source – the Juneau Icefield
2) A model for tidewater glaciers and how this applies to the Taku Glacier
3) The history of the Taku Glacier
4) What is happening now to the Taku Glacier
5) Why the Taku Glacier is going to start retreating at >= 500 ft. per year
1) The Taku Glacier and its
source – the Juneau Icefield
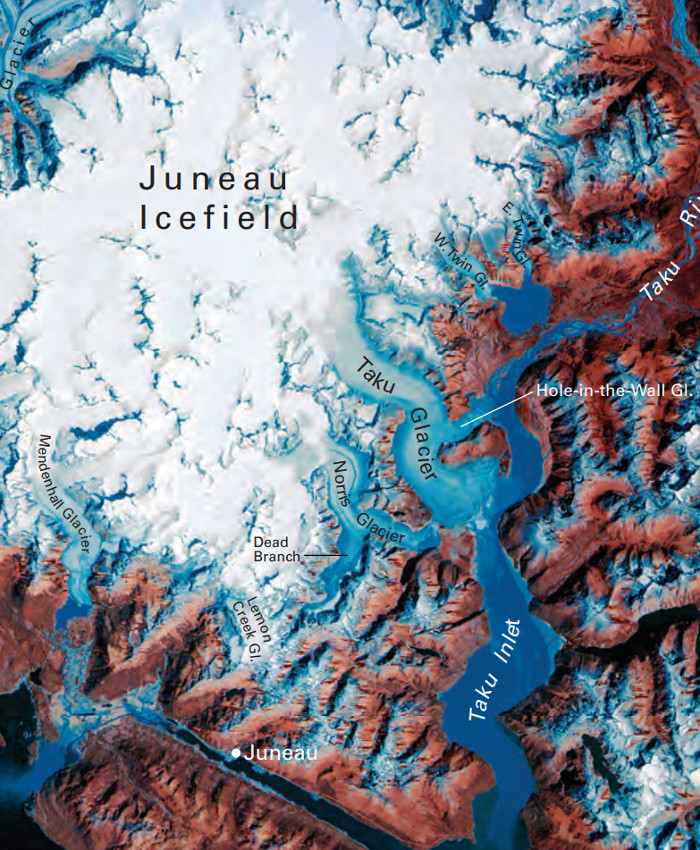
The picture above is a Sept. 1984 Landsat satellite view of the Juneau Icefield. There are about 38 glaciers that drain ice from icefield.
http://www.alaska.org/assets/content/related_items_pdfs/mendenhall_glacier/mendenhall.glacier.pdf
These 38 glaciers include the Taku and Juneau’s major tourist attraction, the Mendenhall. All of these glaciers have been retreating except the Taku. The Taku had been advancing even though it shares the same snow and ice source as the other glaciers. The Taku alone had been advancing – up to now. A closer look at the Taku will begin to explain this anomaly.
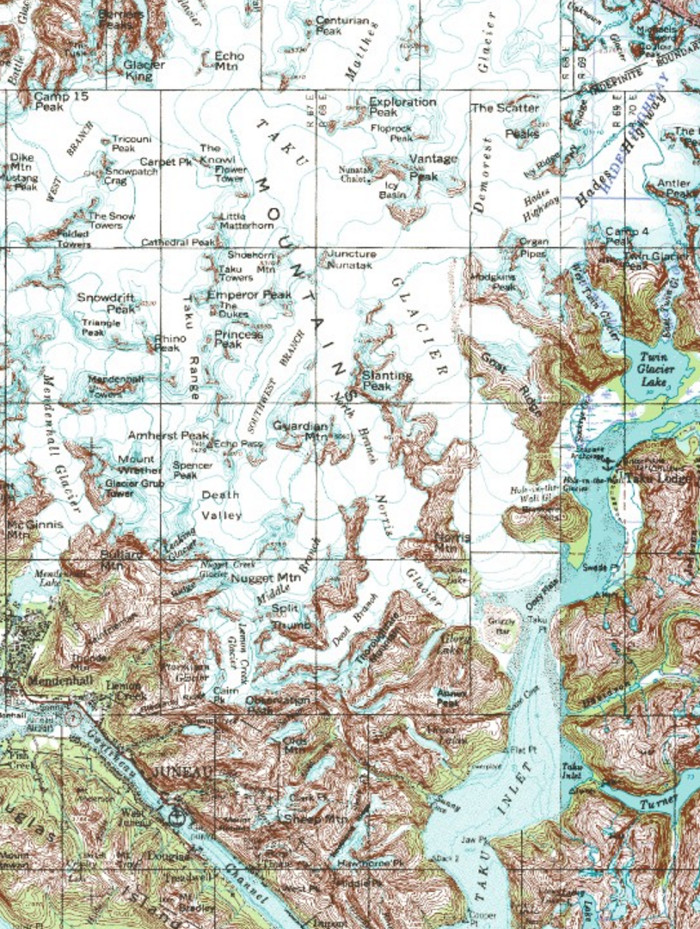
The picture above is a detailed topographic map of the Juneau Icefield (including the Taku and Mendenhall Glaciers). The map was generated via http://www.mytopo.com/
A topographic map provides more information than just a plain satellite view. The topographic map tells us that a large portion of the Taku Glacier’s surface area is less than 4,000 feet above sea level. The elevations on a topographic map are more apparent if we look at a color-coded elevation map.
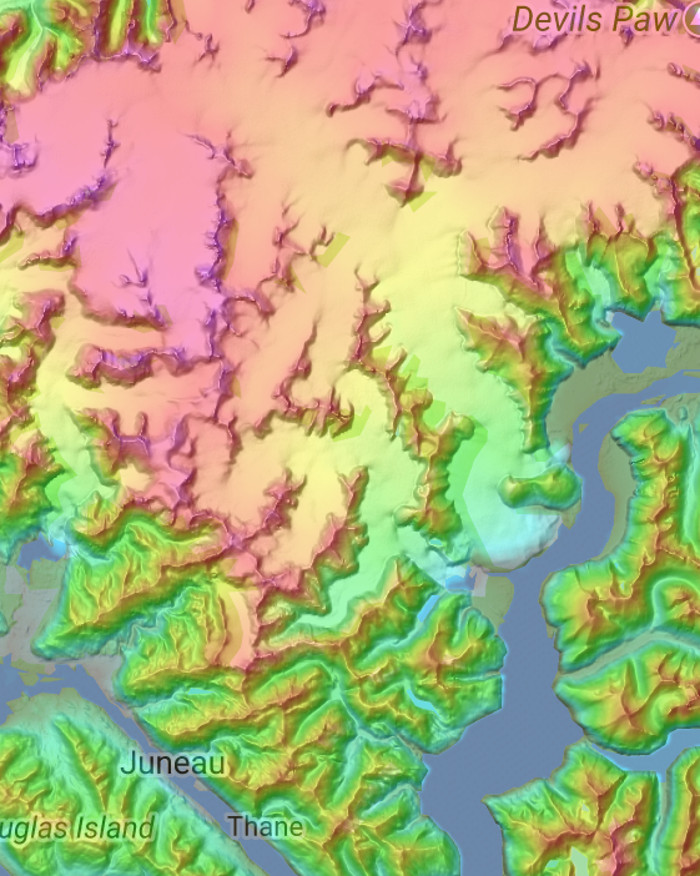
The source for the above picture is at:
http://en-ca.topographic-map.com/places/Juneau-Icefield-692123/
The color-coded map shows that the average elevation of the Taku Glacier is lower than most of the rest of the icefield. At this lower average elevation, precipitation is still mostly snow, but it’s a borderline situation as the slightest increase in temperature will change this precipitation from mostly snow to mostly rain. Global warming is providing this incremental increase in temperature.
If we take a little diversion from the Taku Glacier, it is rather obvious what global warming is doing to one of Juneau’s main tourist attractions – the Mendenhall Glacier. The two pictures below are from the video at https://vimeo.com/69802285
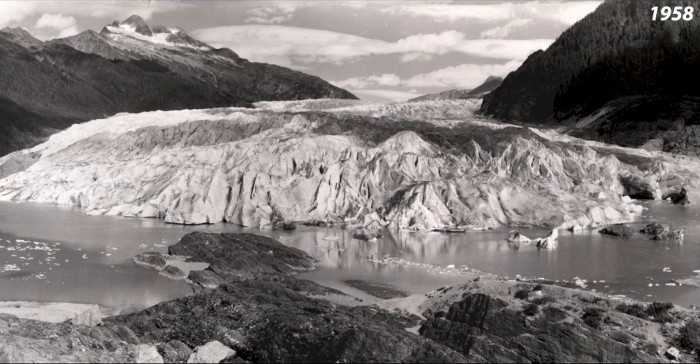
The picture above shows the Mendenhall Glacier as of 1958 as seen from near the current Mendenhall Glacier Visitor Center.
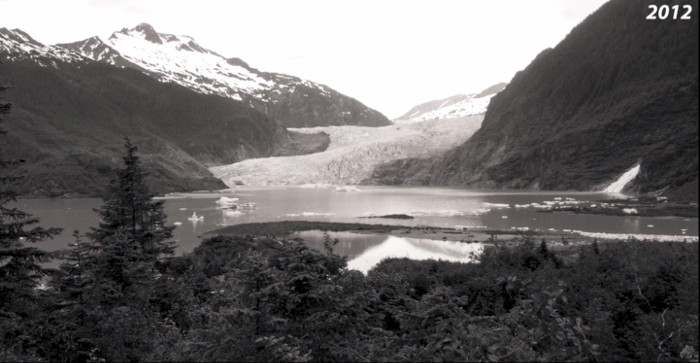
The picture above was taken from the same location and shows the Mendenhall Glacier as of 2012.
It seems probable that at least the lower portion of the Mendenhall Glacier will not be visible from the visitor center in another 20 years. It is important to remember that the Mendenhall and Taku Glaciers have the same source area – The Juneau Icefield.
We will return to the subject of the low elevation of the Taku Glacier and the consequences of global warming in the “5) Why the Taku Glacier is going to start retreating at >= 500 ft. per year” section.
A second major feature of the Taku Glacier is that it is a “tidewater glacier”. Tidewater glaciers terminate at sea level or in terminal moraines that protect them from the ocean. The Taku Glacier is the only glacier that starts in the Juneau Icefield and terminates at sea level. It is this “tidewater glacier” feature that is responsible for the Taku’s advance over the last century.
2) A model for tidewater
glaciers
and how this applies to the Taku Glacier
and how this applies to the Taku Glacier
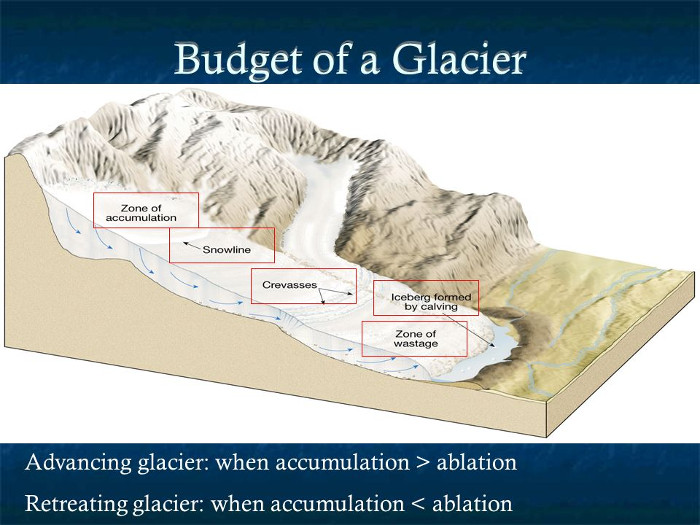
The picture above depicts the major features of a glacier. The source for the picture can be found at http://slideplayer.com/slide/8509495/
The following equations apply to all glaciers. If a glacier is going to remain stable, then:
Snowfall on the glacier =
melting + calving
(From https://en.wikipedia.org/wiki/Ice_calving : Ice calving, also known as glacier calving or iceberg calving is the breaking of ice chunks from the edge of a glacier)
If we remove the restriction “If a glacier is going to remain stable”, then we get a more complete equation that tells us whether a glacier will grow or not.
Snowfall on the glacier =
melting + calving + glacier growth
or alternately by rearranging terms
Glacier growth = snowfall
on the glacier - melting - calving
(Note that “glacier growth” can be negative)
If snowfall is greater than melting + calving, then the glacier will grow. If snowfall is less than melting + calving, then the glacier will shrink.
Calving is an important part of the mass balance/budget of a tidewater glacier. Thus we must look at the Tidewater Glacier Cycle which is superimposed on glacial changes from ordinary climate changes.
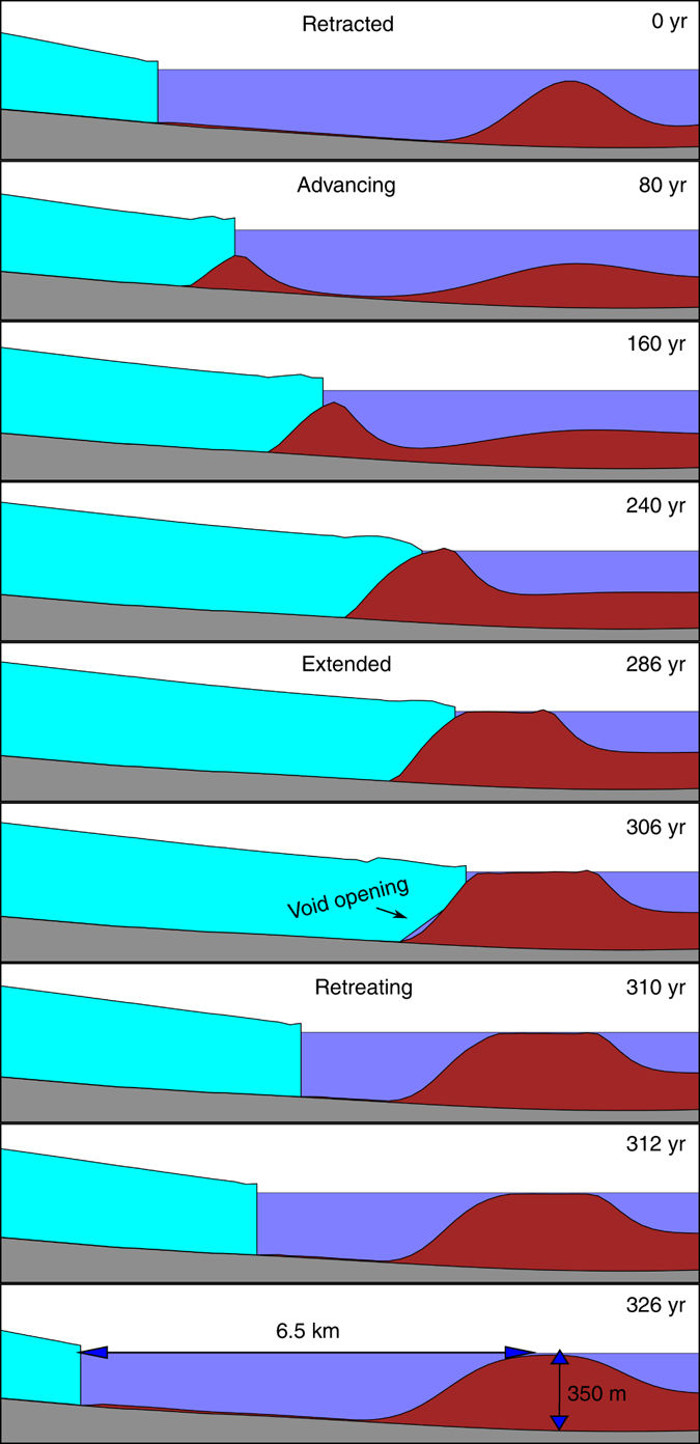
Cyan = glacier
Blue = water
Brown = terminal moraine (push moraine)
Gray = bedrock
The diagram above is from https://www.nature.com/articles/s41467-017-00095-5 , and illustrates a tidewater glacier cycle. In the initial part of the cycle, a tidewater glacier is stable in a “retracted” state. When a glacier is stable, snowfall = melting + calving, and the “glacier growth” is zero.
However glaciers carry rocks and debris, and deposit the rocks & sediment in a terminal moraine.
Except for glaciers in very cold areas, most of of the sediment is transported to the glacier's terminus by melt-water streams that flow under the glacier. In an alpine glacier, these streams continue to transport fine sediment down-slope after they emerge from the glacier; but if the glacier terminates in a water body, the sediment settles out near the terminus.
As the terminal moraine of a tidewater glacier becomes larger, it begins to restrict warm water access to the terminus of the glacier. This decreases melting & calving, and eventually cuts off the calving part of the equation. Even if snowfall decreases slightly, the glacier begins to grow because the melting & calving parts of the equation decrease faster than the snowfall component.
Melt-water from the glacier (which primarily flows under the glacier) erodes sediment from the upstream side of the terminal moraine and redeposits the sediment on the downstream side. Thus the terminal moraine moves downstream. (Most of a tidewater glacier's "push" moraine is transported by this erosion/deposition process as opposed to physical "pushing".)
In the final phase of advance, the glacier's size briefly stabilizes when ordinary surface melting comes into balance with snowfall in the upper reaches of the glacier. However, melt-water that exits from the glacier's terminus continues to erode sediment from the upstream side of the terminal moraine and then redeposits the sediment on the downstream side of the terminal moraine. This opens up gaps between the glacier and its terminal moraine, and these gaps allow surface water to drain back down underneath the terminal area of the glacier. This surface water is a little warmer and thus adds to total melting of what had briefly been a stable "glacier growth" equation. The unstable retreat phase of the glacier's retreat cycle thus begins. (A June 2017 aerial photo of a developing "gap" for the Taku is shown at the end of the "4) What is happening now to the Taku Glacier" section".)
From 1890 to about 2014 the Taku Glacier progressed from the “Retracted” to the “Extended” stages as illustrated above. In terms of distance for the Taku, this advance was about 4.5 miles.
As of 2017, it appears that the Taku Glacier is at the “306 yr” stage of the tidewater glacier cycle. In terms of what happens next, it should be noted that the retreat part of the cycle happens very rapidly. We will cover the “what happens next” in the “5) Why the Taku Glacier is going to start retreating at >= 500 ft. per year” section. But first, we will look at “3) The history of the Taku Glacier” which includes the “Retracted” to “Extended” part of the tidewater glacier cycle.
3) The history of the Taku
Glacier
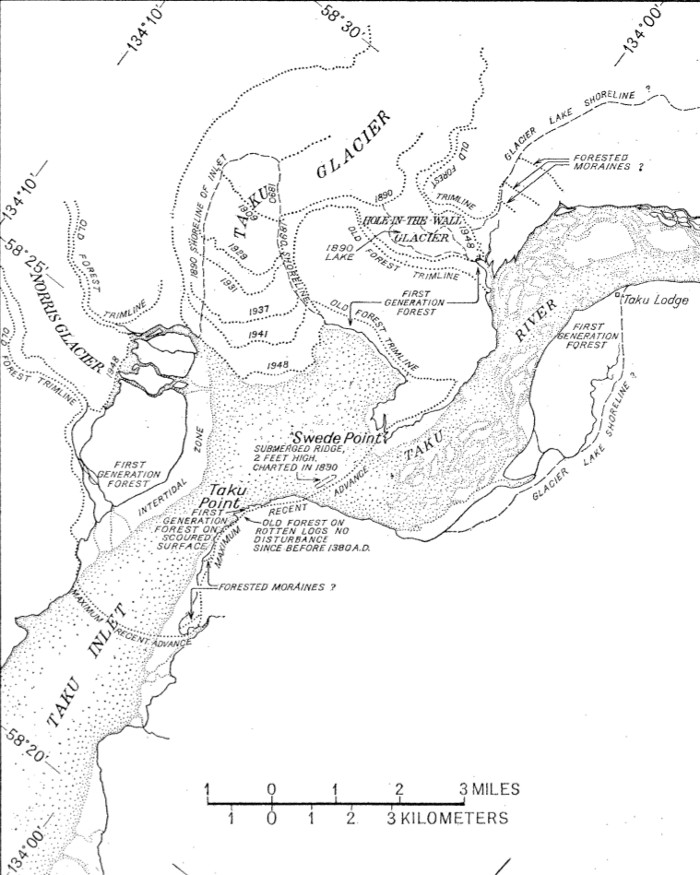
The known history of the Taku Glacier dates back to the 1700s and is a result of excellent field work done in the 1940s by Donald Lawrence who was a professor of botany at the University of Minnesota, Minneapolis. Dr. Lawrence analyzed vegetation above and below old trimlines and moraines throughout the Juneau Icefield area. Using this information he could discover the extent of the Taku Glacier (and other glaciers) and when they were leaving records of their presence at various locations.
(Click on the above diagram to see a larger version that includes a description of the features. - recommended)
The diagram above was part of Dr. Lawrence’s paper that was published by the American Geographical Society’s Geographical Review.
https://www.uas.alaska.edu/arts_sciences/naturalsciences/envs/faculty_staff/pubs/Lawrence_glacier_SE_AK_solar_activity1950.pdf
The dotted lines show where the terminus of the Taku Glacier was as of various dates, and most important, the Taku’s maximum extent. In the middle 1700s the Taku Glacier reached Taku Point – thus blocking the Taku River - which created a lake upstream from Taku Point.
When the lake overflowed, the river scoured (removed all previous vegetation) from parts of Taku Point. New vegetation began to grow after this scouring about 1755-1757.
From Dr. Lawrence’s paper:
More recent investigation of the “Forested Moraines ?” in the lower left quadrant show that the sediments in that area are layered deposits. Since glacial moraines are a mixed jumble of sediments, the “Forested Moraines ?” were deposited via the Taku River and are not a glacial moraine. Thus the maximum extent of the Taku Glacier circa 1750 was to just reach Taku Point (and this maximum extent probably did not last more than a decade or two).
Note: There has been some controversy as to whether the Taku Glacier made it to Taku Point on the southeast side of Taku Inlet.
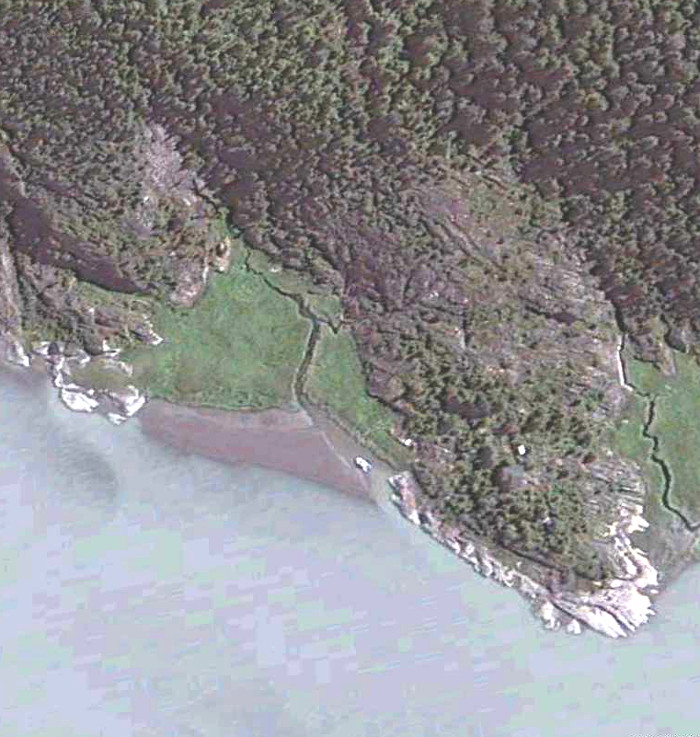
The picture above is a close-up Google Earth view of some of the rock ledges at Taku Point. There are some taller trees on higher ground in the upper right corner. The rock ledges are sparsely covered with smaller vegetation. Even in a rain forest, vegetation does not grow well without adequate soil. It is the author's conclusion that something scraped the soil off the rock ledges within the last few hundred years. The author sides with Lawrence on this one.
The known history of the Taku Glacier dates back to the 1700s and is a result of excellent field work done in the 1940s by Donald Lawrence who was a professor of botany at the University of Minnesota, Minneapolis. Dr. Lawrence analyzed vegetation above and below old trimlines and moraines throughout the Juneau Icefield area. Using this information he could discover the extent of the Taku Glacier (and other glaciers) and when they were leaving records of their presence at various locations.
(Click on the above diagram to see a larger version that includes a description of the features. - recommended)
The diagram above was part of Dr. Lawrence’s paper that was published by the American Geographical Society’s Geographical Review.
https://www.uas.alaska.edu/arts_sciences/naturalsciences/envs/faculty_staff/pubs/Lawrence_glacier_SE_AK_solar_activity1950.pdf
The dotted lines show where the terminus of the Taku Glacier was as of various dates, and most important, the Taku’s maximum extent. In the middle 1700s the Taku Glacier reached Taku Point – thus blocking the Taku River - which created a lake upstream from Taku Point.
When the lake overflowed, the river scoured (removed all previous vegetation) from parts of Taku Point. New vegetation began to grow after this scouring about 1755-1757.
From Dr. Lawrence’s paper:
“At Taku Point (Figs. 6, 9) a first-generation forest that began to grow about 1755-1757 stands immediately below the trimline, and a very old forest perched on rotten logs and surely undisturbed since 1390 or earlier stands above the trimline.”Thus the maximum extent of the Taku Glacier had to occur slightly before this date. The year 1750 is commonly used for this maximum extent. (Note the “or earlier” could be as much as 8,000 years.)
More recent investigation of the “Forested Moraines ?” in the lower left quadrant show that the sediments in that area are layered deposits. Since glacial moraines are a mixed jumble of sediments, the “Forested Moraines ?” were deposited via the Taku River and are not a glacial moraine. Thus the maximum extent of the Taku Glacier circa 1750 was to just reach Taku Point (and this maximum extent probably did not last more than a decade or two).
Note: There has been some controversy as to whether the Taku Glacier made it to Taku Point on the southeast side of Taku Inlet.

The picture above is a close-up Google Earth view of some of the rock ledges at Taku Point. There are some taller trees on higher ground in the upper right corner. The rock ledges are sparsely covered with smaller vegetation. Even in a rain forest, vegetation does not grow well without adequate soil. It is the author's conclusion that something scraped the soil off the rock ledges within the last few hundred years. The author sides with Lawrence on this one.
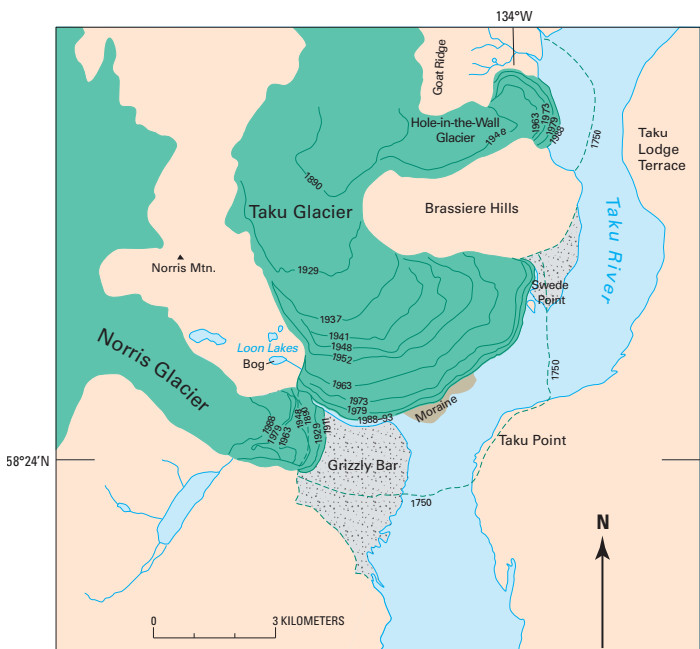
The diagram above is from Fig. 89 of the USGS publication “Part 3 - Descriptions of Alaska’s 14 Glacierized Geographic Regions”. https://pubs.usgs.gov/pp/p1386k/pdf/04_1386K_coastmts.pdf In turn the USGS publication adopted it from the published work of Post and Motyka (1995). The lines drawn on the Taku and Hole-in-the-Wall Glaciers show where the respective terminuses were as of various dates since 1750.
Notes: If you use Google Earth, the 1750 terminal moraine can be easily seen north of the current terminal lobe of the Hole-in-the-Wall Glacier. A 1934 extent line for the Hole-in-the-Wall Glacier could be added using the historic aerial photo of the Hole-in-the-Wall Glacier (shown subsequently below).
The first Europeans to visit the Taku Glacier were surveyors from Vancouver's expedition who rowed small boats up Taku Inlet in Aug. 1794. At that time the area that is currently occupied by the last couple of miles of the Taku Glacier was a fjord. Their description of the area as quoted from Roman Motyka’s “Taku Glacier Advance – Preliminary Analysis” ( http://pubs.dggsalaskagov.us/webpubs/dggs/pdf/text/pdf1989_012.pdf ) was:
He reported large numbers of floating icebergs in Taku lnlet especially at the entrance, through which "passage was with difficulty effected". At a point about 21 km (13 mi) up the inlet (the approximate vicinity of Taku Point) he describes "the shores spread to the east and west, and formed a basin about a league broad, and 2 leagues across, in a N.W. and S.E. direction, with a small island lying nearly at its north-east extremity" (1 league = 3 miles = 4.83 km), and further describes "immense bodies of ice, that reached perpendicularly to the surface of the water in the basin". This description fits the tidal basin that existed in front of the Taku Glacier terminus when it was first charted in 1890 by the USC&GS (fig. 2) and would place the terminus well up-fjord but still fronting in tidewater in 1794 as icebergs were apparently quite common.
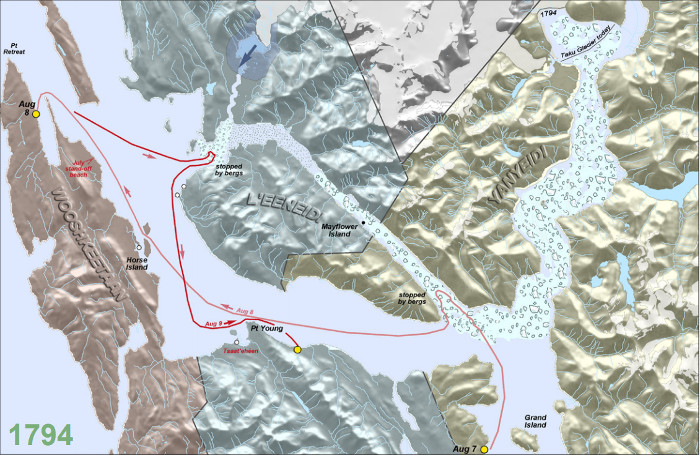
The picture above is a generated view of the Juneau/Taku Inlet area, and shows the approximate Aug. 1794 exploration survey route of Joseph Whidbey (surveyor with the Vancouver Expedition). The picture is part of a presentation that can be seen at https://www.discoverysoutheast.org/wp-content/uploads/2017/06/1867-2017.pdf
In the picture, icebergs fill both the Taku Inlet (near the right edge) and Gastineau Channel (center of picture). Whidbey's side trip up the Taku Inlet is not shown, but based on his description he probably got as far as the present terminus of the Taku Glacier. (The Taku's 1794 terminus was approximately at "1794" next to the extreme top edge.)
From 1794 to present, the earth's crust has probably risen at least 10 feet in this area due to glacial isostatic rebound and tectonic mountain building. In 1794, Gastineau Channel would have been a through flowing water channel, and ice bergs at both ends most likely came from the rapidly disintegrating terminus of the Taku Glacier.
David Rumsey ( https://www.davidrumsey.com ) has a treasure trove of old maps - including a 1798 map which includes information from Vancouver's voyage into Taku Inlet. The following 3 maps from the late 1790s through the 1800s show what was known about the Taku Glacier's terminus relative to Taku Inlet.
(Maps can be found at:
https://www.davidrumsey.com/luna/servlet/view/all/where/United%2BStates/Alaska?sort=Pub_List_No_InitialSort%2CPub_Date%2CPub_List_No%2CSeries_No )
What is significant is that none of the maps show a retreat by the Taku Glacier any further upstream than the extreme western end of the Brassier Hills.
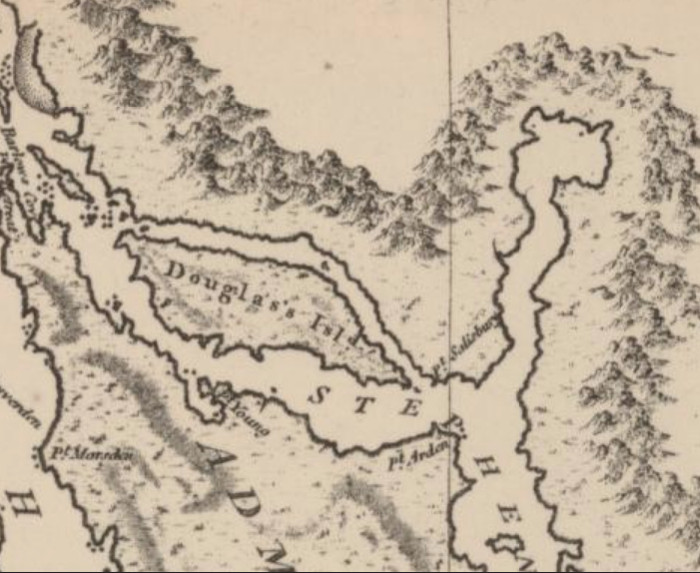
The map above was published in 1798. The future location of Juneau, Alaska will be across the channel to the Northeast of Douglas Island. The map shows Taku Inlet extending toward the upper right corner of the page.
While the map doesn't show any identification for glaciers, the terminus of Norris Glacier would be on the western side of the basin at the northern end of Taku Inlet. The terminus of the Taku Glacier would be on the northernmost point of this basin. The small bay on the northeast side of the basin would be the Taku River.
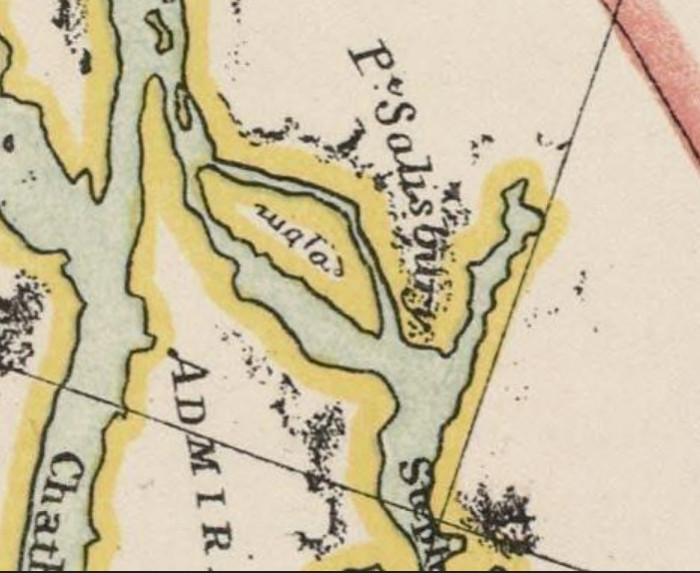
The map above was published in 1831. Douglas Island is near the center of the map with Taku Inlet extending upward on the right side of the map.
Again there are no glaciers shown, but the terminus of the Taku Glacier would be at the extreme north end of Taku Inlet. If you compare the above 1831 map with the preceding 1798 map, it would appear that the Taku Glacier had retreated to just south of the present location where the Hole-in-the-Wall Glacier branches off from the Taku. The information source for the 1798 to 1831 retreat of the Taku is not known. (The pink area in the upper right is a "best estimate" of the Alaska/Canada border.)
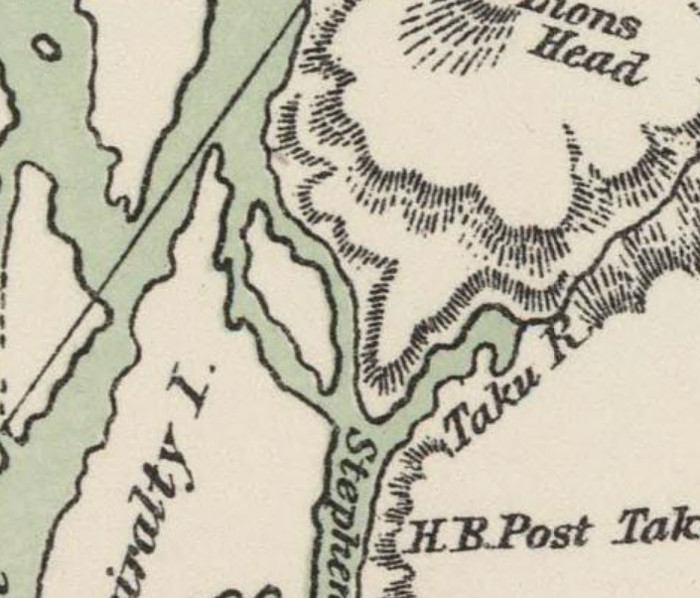
The map above was published in 1869. Douglas Island is slightly left of center while Taku Inlet is to the right. The terminus of the Taku Glacier would be at the extreme north end of Taku Inlet.
While the map lacks good details, it would appear that the Taku had advanced from 1831 to 1869.
By 1890 the U. S. Coast and Geodetic Service published a good detailed map.
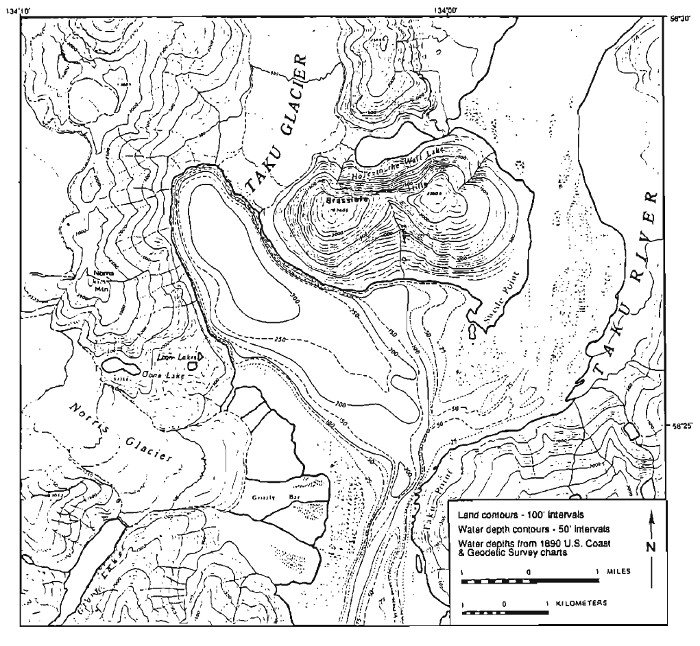
(The picture above is a copy of the USC&GS 1890 map as shown in Motyka’s paper)
In addition to the Taku Glacier’s retreat and advance since 1750, there are two items of interest. The first is the 300+ foot depth of the fjord immediately downstream from the Taku's 1890 terminus. The second is “Hole-in-the-Wall Lake” near the top edge of the diagram. The subsequent advance and thickening of the Taku Glacier would spread ice across this 1.2 mile long lake and over the low ridge east of it to form the Hole-in-the-Wall Glacier. The west end of the lake was probably bounded by a lateral moraine from the Taku Glacier.
When the results of Lawrence, Vancouver, the USCGS (and subsequent observations of the Taku), and others are combined, we get a picture of what has been happening to the Taku over the last 300 years.
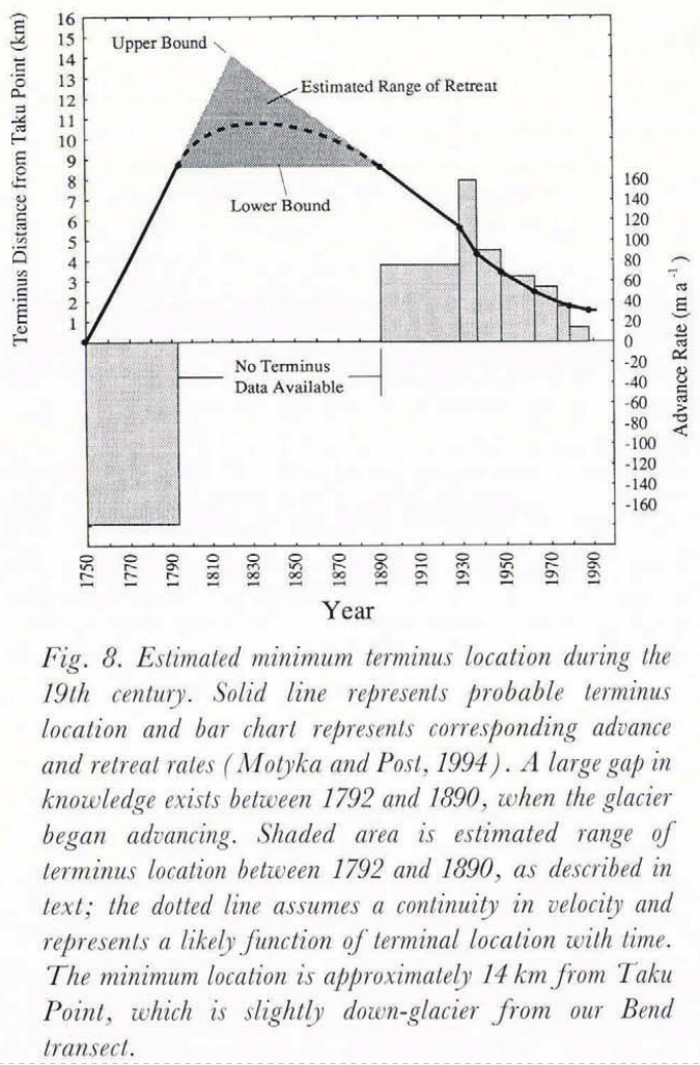
The solid line in the above chart is from a paper by Nolan, Motyka, Echelmeyer, and Trabant that was published in the Journal of Glaciology ( https://www.igsoc.org/journal/41/139/igs_journal_vol41_issue139_pg541-553.pdf ). It shows the known positions of the Taku Glacier’s terminus starting with 1750, while the dashed line is a best estimate of where the terminus was in-between Vancouver’s trip and the USCGS’s map. From the Taku’s maximum extent at Taku Point in 1750, it retreated some 10 to 11 km (to near or slightly downstream from the location where the Hole-in-the-Wall Glacier currently branches off), and then (anomalously compared to most other glaciers) the Taku advanced until “about” 2014.
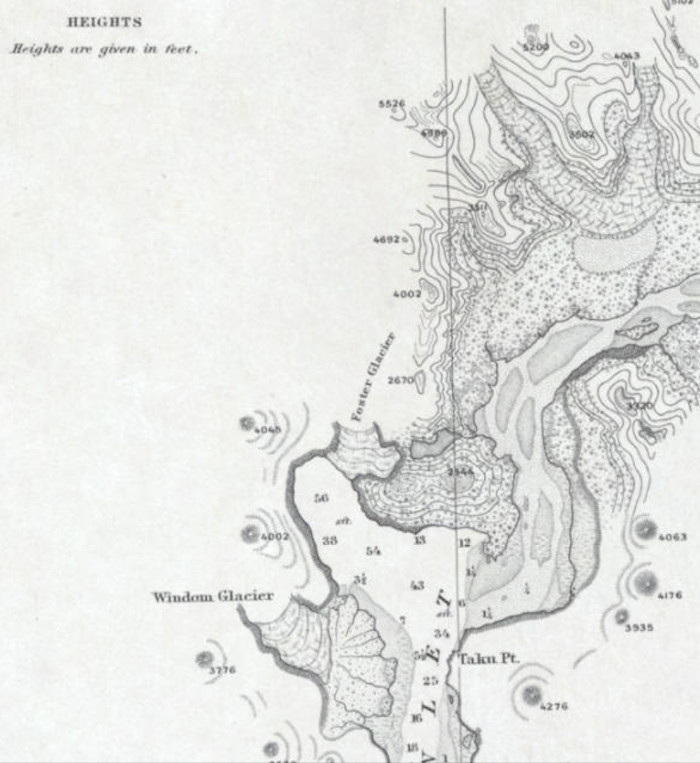
The picture above is a segment from the 1895 “Lynn Canal and Stephens Passage, S.E. Alaska” U. S. Coast and Geodetic Survey chart. An original view of the chart can be downloaded from the University of Alaska's “Alaska Digital Archives” at: http://vilda.alaska.edu/cdm/search/searchterm/Lynn%20Canal%20(Alaska)/field/locati/mode/exact/page/2
(Click on page 2)
Norris Glacier (then known as Windom Glacier) can be seen in the lower left quadrant. Taku Glacier (then known as Foster Glacier) is slightly below and just left of center.
Hole-in-the-Wall Glacier doesn’t exist yet, but Hole-in-the-Wall Lake (not labeled) is just to the right of Taku/Foster Glacier. Over the next 4 decades, the Taku will thicken and push an arm eastward over Hole-in-the-Wall Lake and a low ridge to produce Hole-in-the-Wall Glacier. Finally, (near the top right corner) East and West Twin Glaciers (not labeled) join to form a single lobe which occupies over one half of the present location of Twin Glacier Lake.
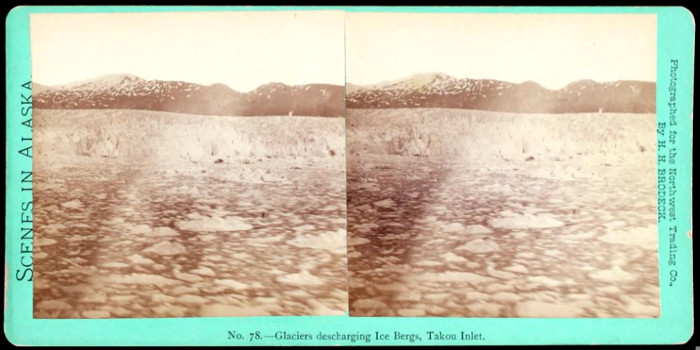
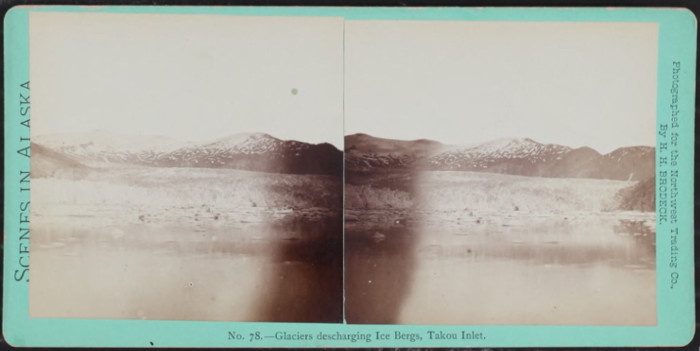
The first known photographs of the Taku Glacier were taken by Henry Brodeck in 1877. Brodeck's "stereo" photos include two of the Taku (not labeled in the collections but easily identifiable), and several other photos of the Norris Glacier. The Norris Glacier photos appear to be mislabeled as they are identified as the "Schulze Glacier" (former name of the Taku). One of these "Schulze photos" has the easily identifiable Norris Mountain in the background, and this solves the misidentification problem.
The photographic collections can be seen at:
https://archive.org/details/photographsbyhen00brod/page/n7 (also at /n5)
and
https://digital.history.pcusa.org/islandora/search/Brodeck?type=dismax
The 1877 view above looks NNE over the terminus of the Taku Glacier. Goat Ridge is in the background. Click on picture for a large version.
The 1877 view above looks NNE over the terminus of the Taku Glacier. Goat Ridge is in the distant background. The extreme western end of the Brassier Hills can be seen in the middle distance near the right edge of the photo. Click on picture for a large version.
The photograph below is perhaps the best of several known 1891 photos of the Taku Glacier.
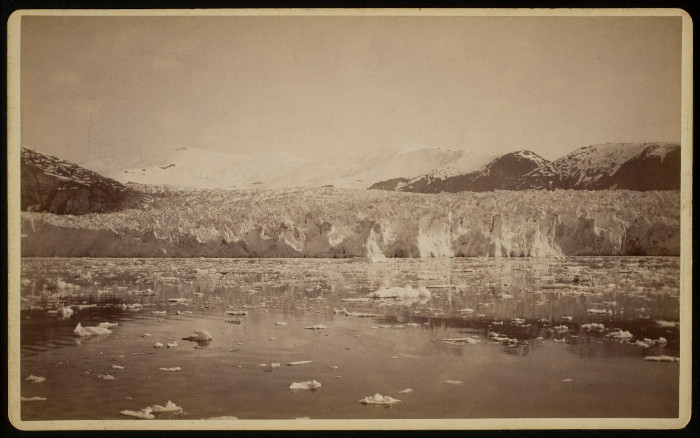
The photo above is from the Eastman collection.
http://collections.eastman.org/objects/107828/taku-glacier?ctx=f411cab2-014f-49a9-b3c4-0d80faedcb05&idx=5
The Taku Glacier presents a steep calving face which is typical of tidewater glaciers terminating in deep water. There was probably a submerged terminal moraine well below the water’s surface, but it will be decades before it becomes large enough to be visible. The mountains in the center and right background are Goat Ridge. The present location where the Hole-in-the-Wall Glacier splits off the Taku is just off the right edge of the photo.
At the time of the photo, the fjord was about 300 feet deep at the photographer's location. The same area now is covered by ice that extends about 1,100 feet above sea level.
(Several 1877 photographs of the "Schulze Glacier" (former name of the Taku) exist, but they show a "push moraine"/gravel bar in front of the glacier. This, and background ridge lines don't correlate well with the above photo. The distant ridge line of the last of these photos does match what an 1877 view of the Norris Glacier should look like.
https://digital.history.pcusa.org/islandora/search/schulze?type=dismax )
Shortly after the above photograph was taken, the tourist “cruise boat” industry took off. The following two photos show a couple of the early steamships bringing sightseers to the “wonders of Alaska”.
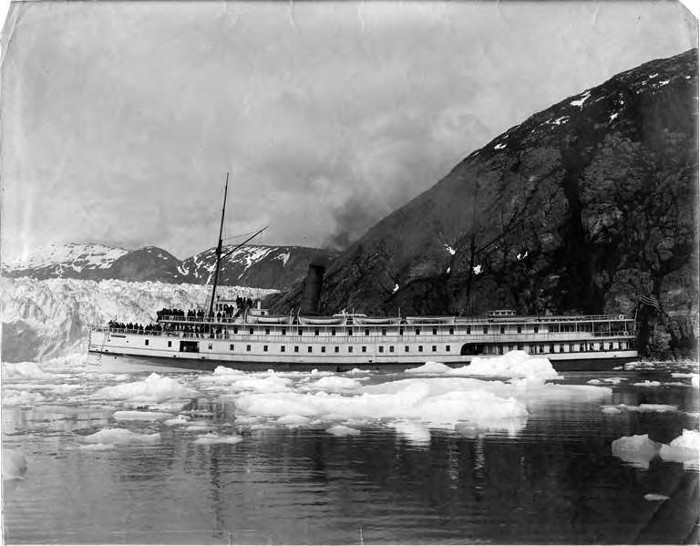
The steamship “Victorian” is in
front of the Taku Glacier in 1900.
Picture source:
https://commons.wikimedia.org/wiki/File:Steamship_VICTORIAN_making_a_tourist_stop_at_Taku_Glacier,_Alaska,_ca_1900_(HESTER_305).jpeg
The view looks NE with the Brassier Hills on the right side of the photo and the extreme
Picture source:
https://commons.wikimedia.org/wiki/File:Steamship_VICTORIAN_making_a_tourist_stop_at_Taku_Glacier,_Alaska,_ca_1900_(HESTER_305).jpeg
The view looks NE with the Brassier Hills on the right side of the photo and the extreme
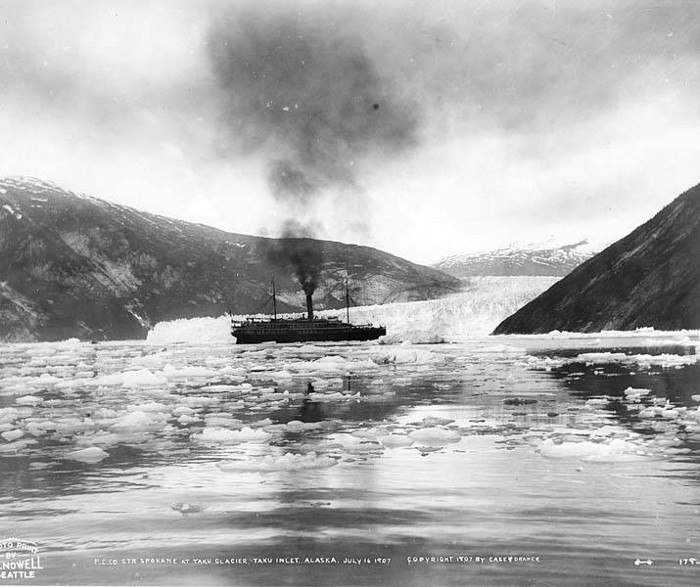
The original source of the above 1907 picture of the steamship Spokane in front of the Taku Glacier can be seen at:
https://commons.wikimedia.org/wiki/File:Steamship_SPOKANE_at_Taku_Glacier,_Taku_Inlet,_Alaska,_1907_(NOWELL_78).jpeg
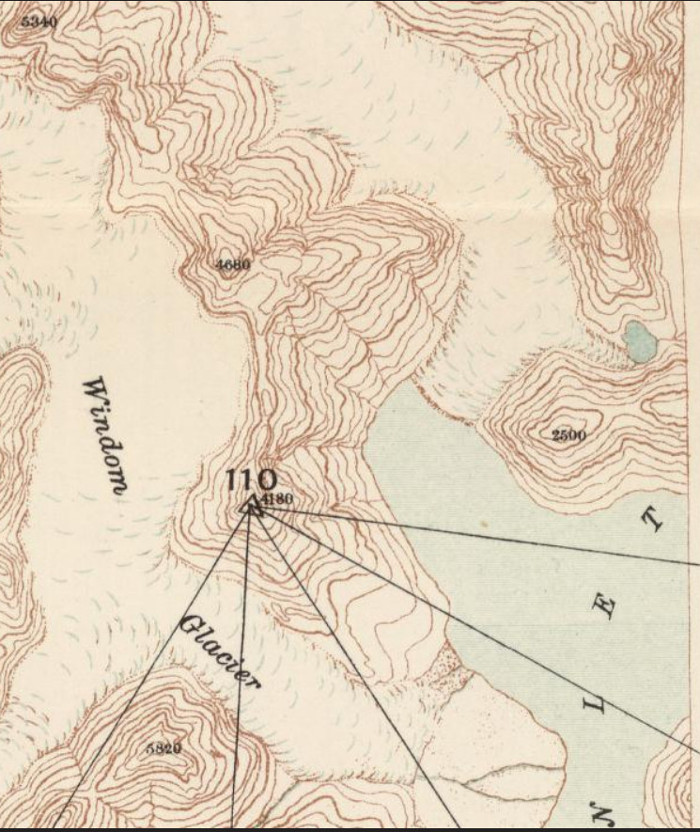
The above picture is a c. 1903 topo map of the Taku Glacier region. The original full map which includes the entire Juneau/Taku Inlet area can be seen in the David Rumsey Map Collection. https://www.davidrumsey.com/luna/servlet/workspace/handleMediaPlayer;JSESSIONID=1d1c057a-b52c-4eaa-b4a1-73ee6d5b2af9?lunaMediaId=RUMSEY~8~1~204982~3002242
and/or
https://www.davidrumsey.com/luna/servlet/workspace/handleMediaPlayer?lunaMediaId=RUMSEY~8~1~204995~3002255
(This second link is a composite series of maps that includes the Taku River, Twin Glaciers, etc.)
In the above map, the Norris (Windom) Glacier flows from top to bottom along the left edge. The Taku Glacier (not labeled) flows from the top edge to just to the right of the center of the map. Hole-in-the-Wall Glacier doesn't exist yet, but an arm of the Taku Glacier is beginning to overrun Hole-in-the-Wall Lake (Near the right edge).
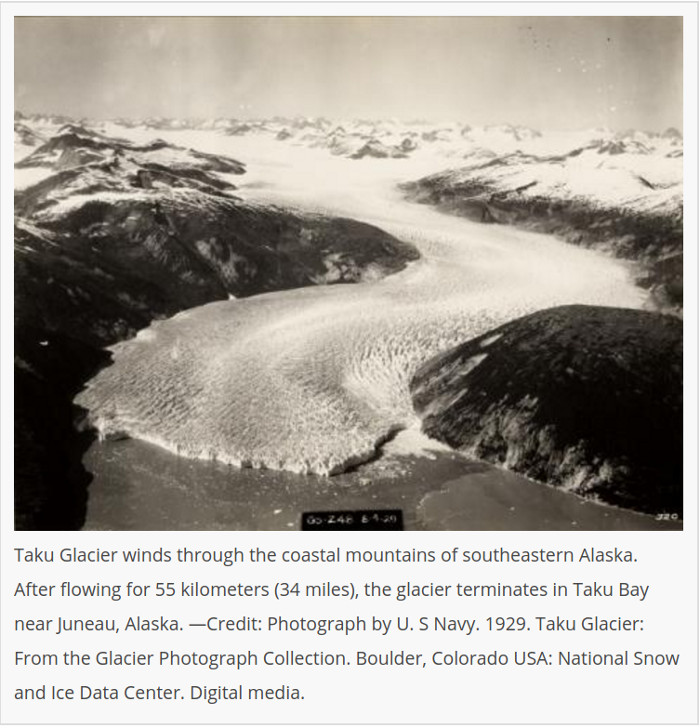
The original source for the above 1929 aerial view is:
https://nsidc.org/cryosphere/glaciers/gallery/tidewater.html
In the above aerial photo, note the deep water-filled fjord in front of the glacier. (Work by Motyka gives a depth of 300 feet.) That deep fjord is still there except it is currently filled with the Taku Glacier’s ice. In a few short decades, it’s all going to be water again.
History of the Taku’s
distributary – The Hole-in-the-Wall Glacier
By the 1920s, the thickening of the Taku Glacier started to push an arm eastward over the old Hole-in-the-Wall Lake. The photographs below show what happened next.
(Click on the photo for a large version)
The photo above is from the National Park Service's gallery.
https://npgallery.nps.gov/AssetDetail/580cb444-ad4c-49ef-bbf6-1f16ce9399d7
If you click on the above link, you can download the original PDF that also includes early photographs of the Twin Glacier Camp (Former name of the Taku Glacier Lodge)
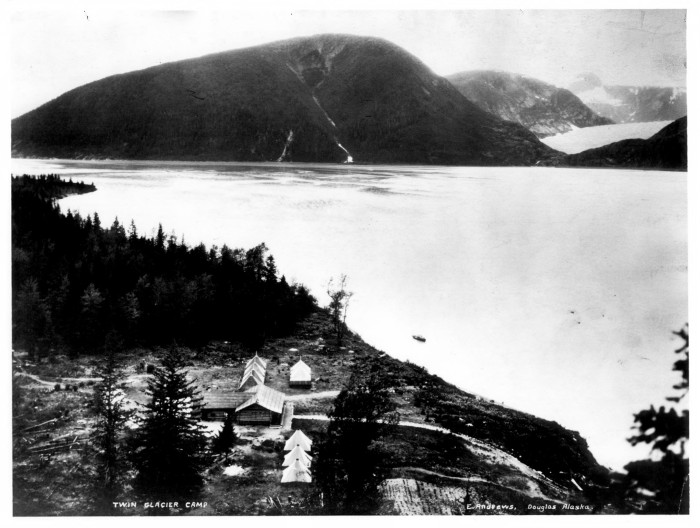
The photo shows the Twin Glacier Camp in the foreground, and the incipient Hole-in-the-Wall Glacier in the background as of an estimated date in the mid to late 1920s. This is the earliest known photo of these two entities.
(Click on picture for a larger image)
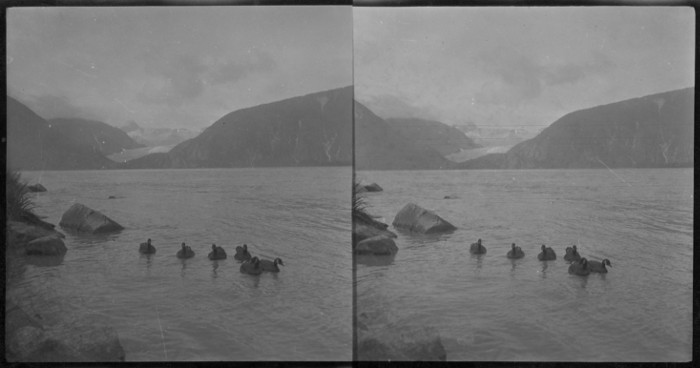
The stereo picture above is from the Keystone-Mast Collection, UCR/California Museum of Photography, University of California at Riverside with a title listed as "Wild Geese at Twin Glacier Camp 35 miles from Juneau, Alaska."
http://imgzoom.cdlib.org/Fullscreen.ics?ark=ark:/13030/kt4489p787/z1&order=2&brand=oac4
The date and photographer are not known, but the date can be reasonably estimated as about 1930 to 1935.
The view is from near the current dock for the Taku Glacier Lodge (then known as the Twin Glacier Camp), and looks west across the Taku Inlet/River towards the "Proto" Hole-in-the-Wall Glacier. The most valuable aspect of the picture is that it allows a pre-glacier comparison of the skylines of the mountains in the middle and far distance vs. what can be seen now.
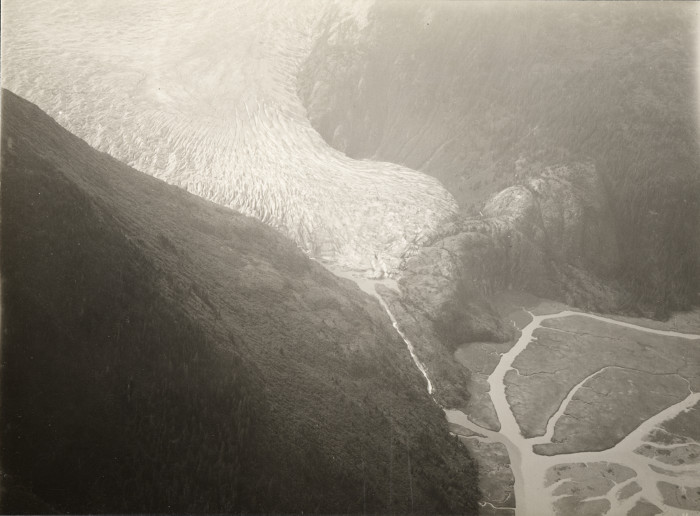
The photograph above is courtesy of the Glacier Photograph Collection at the National Snow & Ice Data Center. http://nsidc.org/data/glacier_photo/search/
The picture above shows the Hole-in-the-Wall Glacier as of 1934 before the Taku Glacier thickened enough to overflow the low ridge between the Brassier Hills (lower left) and Goat Ridge (upper right). In subsequent years, the Taku Glacier (upper left) would overflow the low ridge (right-center) onto the low flats (lower right) – thus forming the Hole-in-the-Wall Glacier.
There is still a very small portion of the former Hole-in-the-Wall Lake remaining between the glacier and the crest of the low ridge.
The lack of trees on the low ridge indicates the Taku had overflowed the area sometime in the previous 300 years, and had scraped off all the soil that trees would need to grow.
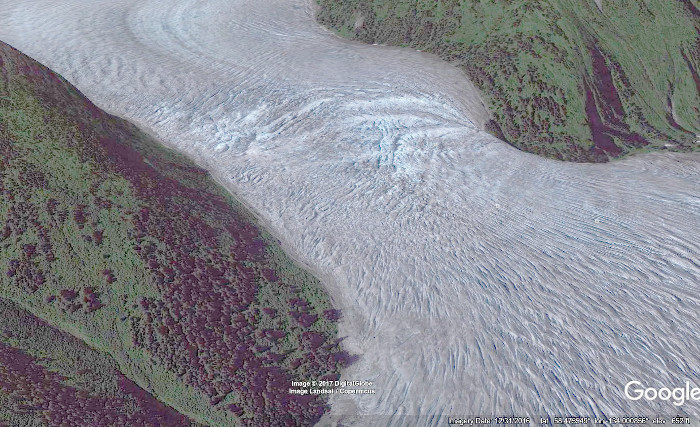
The picture above is a Google Earth approximation of what the same Hole-in-the-Wall Glacier area looked like in July 2010. The large crevasses are formed where the glacier overrides the old low ridge. Note the trimline that is beginning to form on the left side of the glacier.
The following 2 photographs were included as part of Dr. Donald Lawrence's paper that was published by the American Geographical Society.
https://www.uas.alaska.edu/arts_sciences/naturalsciences/envs/faculty_staff/pubs/Lawrence_glacier_SE_AK_solar_activity1950.pdf
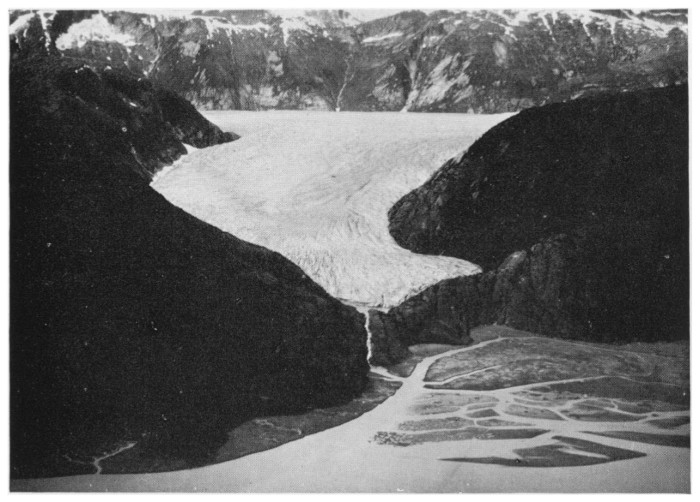
The photo above was taken in 1934 and shows the incipient Hole-in-the-Wall Glacier just before it pushed over the low ridge. The Taku Glacier flows from right to left in the background.
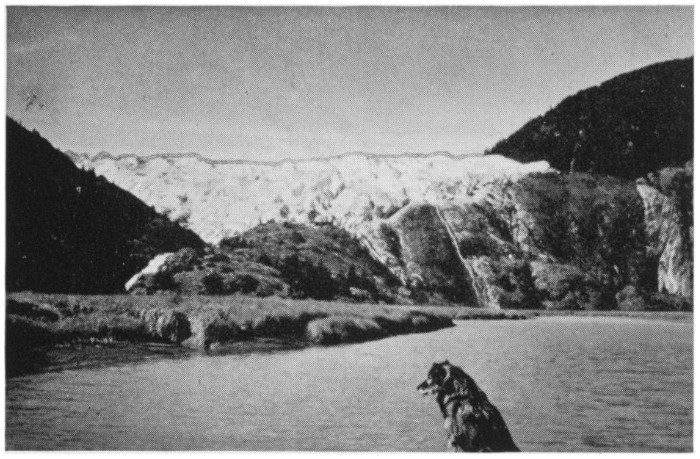
The 1941 photograph above shows the Hole-in-the-Wall Glacier just as it is beginning to overflow the low ridge. Presumably the dog in the foreground is one of the famous sled dogs from the Taku Glacier Lodge, and is sitting in the bow of a small boat. The photographer's location is on the west side of the Taku River, nearly 2 miles WSW to SW of the Taku Glacier Lodge, and looks west toward the glacier.
The photographer's location is probably near the point of land that is just below and to the right of the cataract in the preceding picture. This would be inside of the southernmost current lobe of the terminus of the glacier.
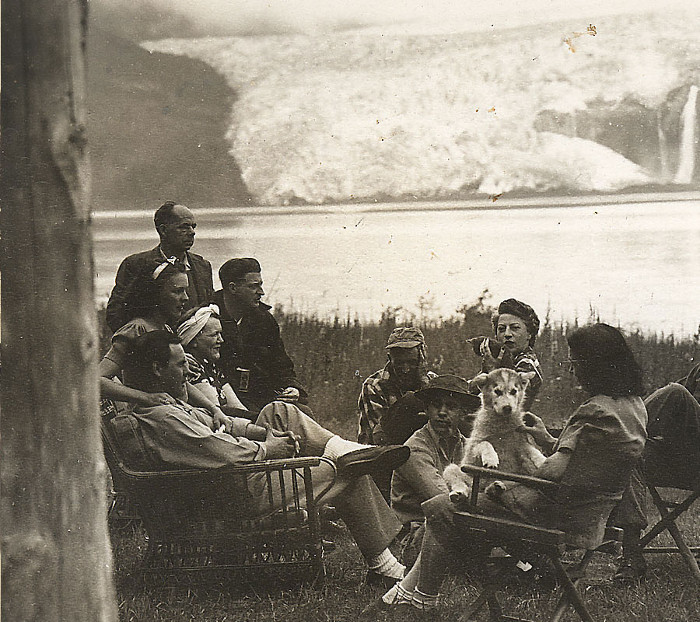
The Hole-in-the-Wall Glacier as viewed from the Taku Glacier Lodge as of (estimated) 1948. A similar picture is available at http://theproperfunction.com/taku-glacier-lodge-hop-aboard-seaplane-soar-five-glaciers-visit-historic-lodge/
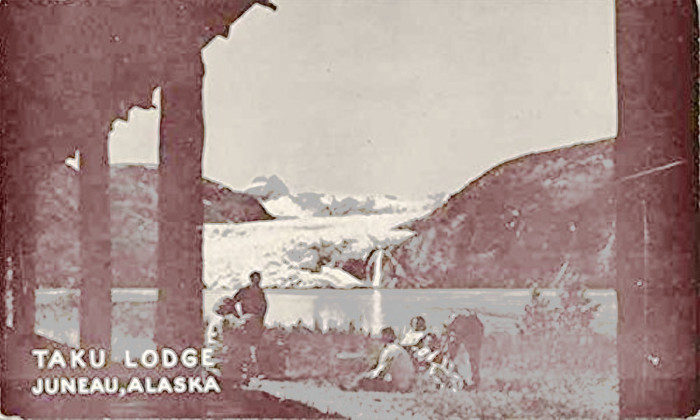
The picture above is from a “vintage picture postcard” and shows a similar view as given in the previous picture. The date is again estimated as c. 1948. If you compare the distant mountains above the glacier with the similar Google Earth view (3 pictures down), you can get an idea of how much the glacier thickened from 1948 to the early 2000s.
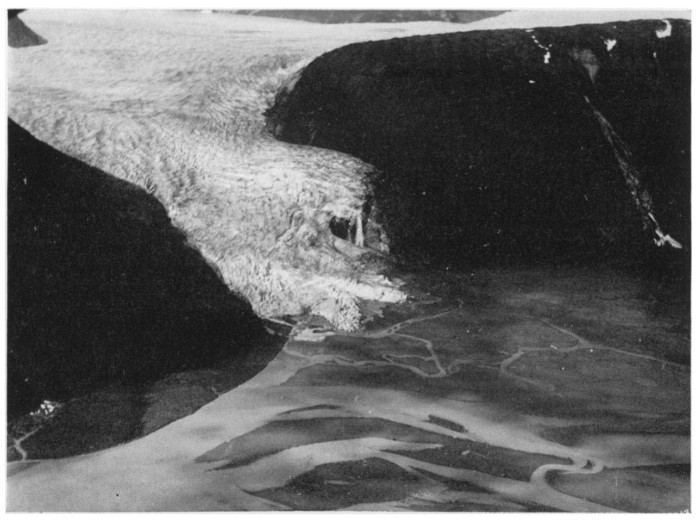
The photograph above was again taken by Dr. Donald Lawrence, and was also included in his American Geographical Society paper. By 1949 the glacier had thickened enough to completely overflow the low ridge. the Hole-in-the-Wall Glacier would continue to expand for another 55 (+/-) years.
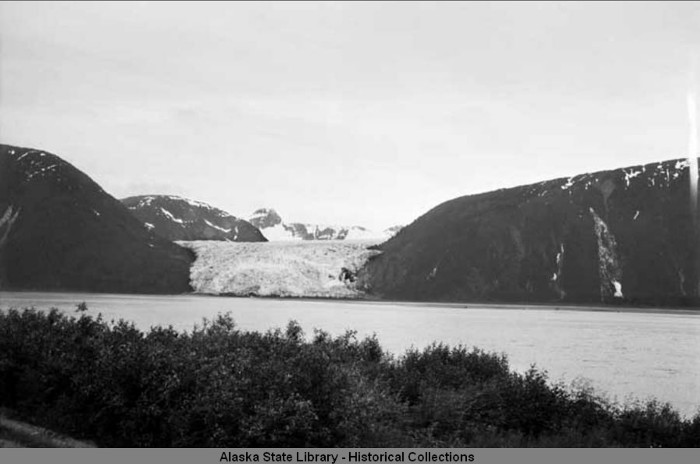
The photo above is a view of the Hole-in-the-Wall Glacier as seen from Taku (Glacier) Lodge c. 1951. The original photo can be seen at: http://vilda.alaska.edu/cdm/ref/collection/cdmg21/id/11239
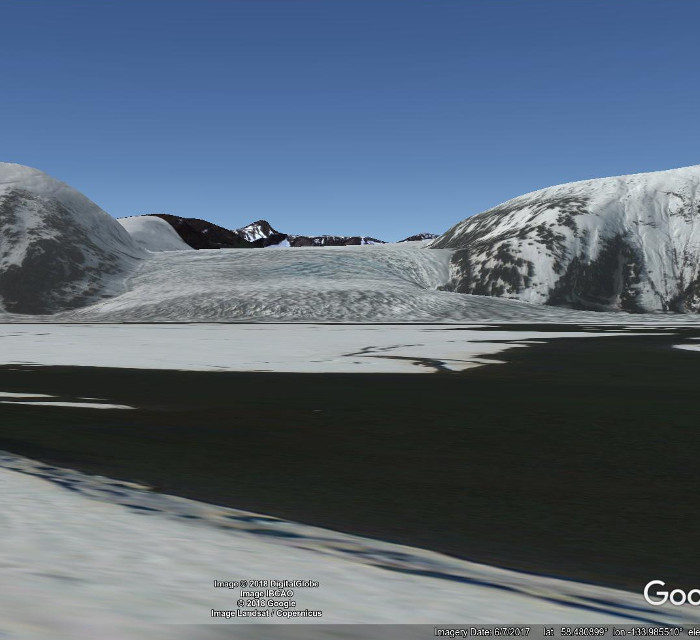
The picture above was generated via Google Earth and shows the Hole-in-the-Wall Glacier as of 2010. The generated view is from approximately the same location.
If you compare the two views, especially with respect to the surrounding mountains, by 2010 the Hole-in-the-Wall Glacier had thickened by 200 to 300 feet, and both sides were some 500 feet wider than they were in 1951.
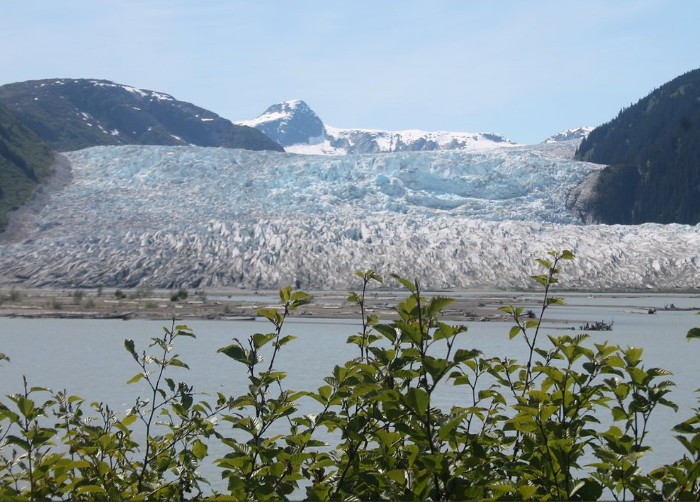
The photograph above was posted by “laurag35” on the tripadvisor.com website. It is a view of the Hole-in-the-Wall Glacier from the Taku Glacier Lodge as of June 2018.
If you compare the top of the glacier relative to the snowfield below the high peak in the background vs. the preceding 2010 Google Earth view, it appears that the glacier has thinned significantly from 2010 to 2018. Also, large areas of gray, bare rock can be seen below the trim lines on both sides of the glacier.
The large ice cliff on the right side of the glacier is also significant. It appears that the glacier has hung up (nearly stopped moving) on the right end of the old buried ridge. This old rock ridge can be seen in the 1948 picture postcard view. The top of the old rock ridge is perhaps only 20 to 30 feet below the base of the ice cliff and may begin to become visible in another 5 to 10 years.
If a future photograph is made in 2100, it is expected that a comparable view will not include ANY ice. (And it may very well take a few decades less.)
The next two pictures can be used to compare the north edge of the Hole-in-the-Wall Glacier in 1949 with the same area in 2019.
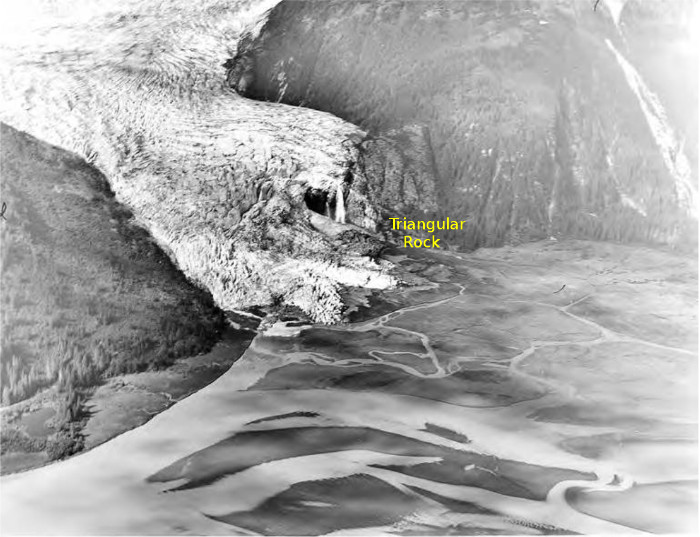
The picture above is the same 1949 view of the Hole-in-the-Wall Glacier as photographed by Dr. Lawrence, but is a better quality and is copied from the University of Washington's collection. https://digitalcollections.lib.washington.edu/digital/collection/epic/id/6104/rec/2595 The triangular rock to the right of the waterfall (and above the text label) is of interest since the top of this rock is also visible in a photograph taken by the author in June 2019. (See below)
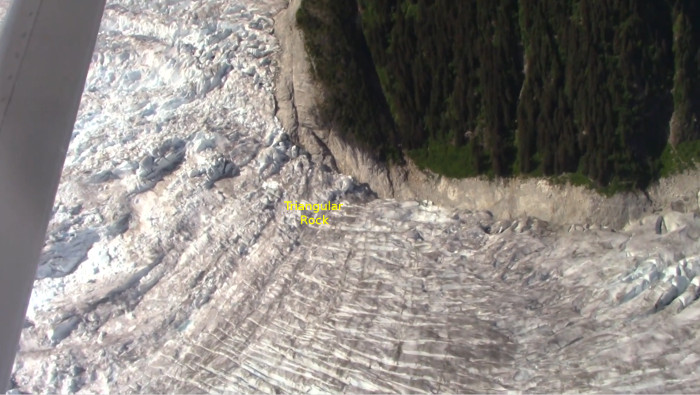
The photograph above was taken by the author in June 2019, and shows the north side of the Hole-in-the-Wall's icefall. The top of the triangular rock is visible just above the text label. The bare rock trimline between the glacier and the forest above it shows how much the glacier has thinned since the early 2000s. If the glacier continues to thin and retreat at this rate, the waterfall will become visible again sometime in the 2030s. (The waterfall will only exist for a year or two until continued glacial melting will allow the meltwater stream to go somewhere else.)
2020 Update
The author had planned to take a trip to Alaska in 2020 to get photos of recent developments, but those plans got chewed up by the COVID-19 pandemic. Fortunately the USGS' LandsatLook satellites were finally able to get a view in Sept. 2020 (Most of Alaska's summer was cloudy/rainy.) The resolution in the LandLook series doesn't match the usual photographic images, but Alaska's glaciers are still big enough to overcome that handicap. In any case it's possible to compare what the glacier looked like in 2010 with what it looked like in 2020.
(Click on the picture for a large version.)
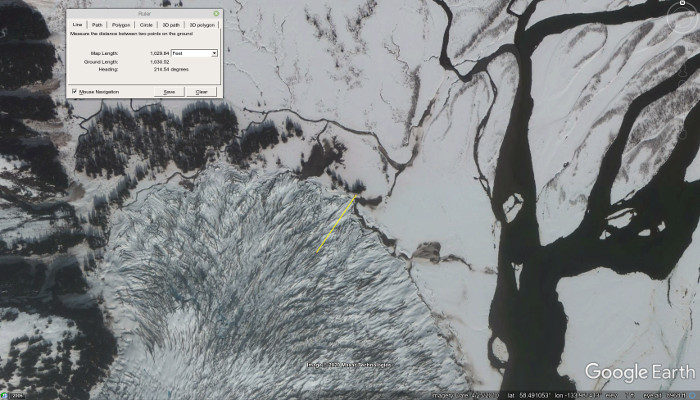
The picture above is a 2010 Google Earth view of the terminus of the Hole-in-the-Wall Glacier. The leading edge of the glacier is just a few feet from the trees. The yellow line is Google Earth's measuring tool and shows how large a gap would exist if the glacier were to retreat 1,000 feet or so.
(Click on the picture for a large version)
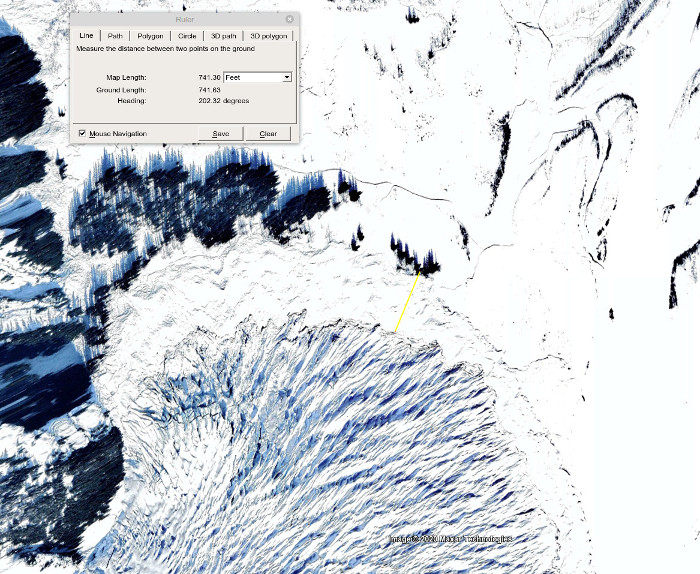
The picture above is a March 2020 Google Earth view of the terminus of the Hole-in-the-Wall Glacier. The leading edge of the glacier is now about 741 feet from the trees. The yellow line is Google Earth's measuring tool to document this ~740-foot retreat. The terrain between the trees and the glacier shows rumpled annual terminal moraines. After the winter's snow melts this terrain will become mostly mud since vegetation has not had enough time to become established.
(Click on the picture for a large version.)
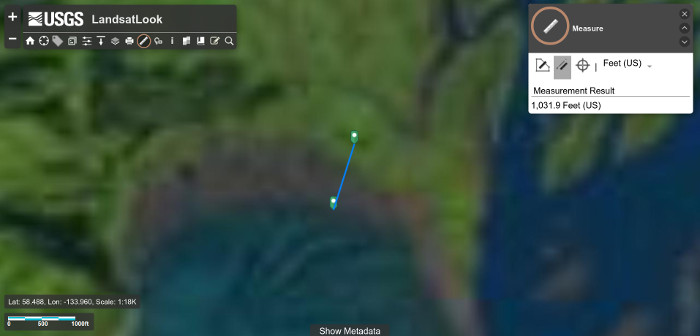
The picture above is a Sept. 2020 USGS LandLook view of the terminus of the Hole-in-the-Wall Glacier. The leading edge of the glacier is now over 1,000 feet from the trees. Brown mud is exposed where vegetation hasn't had a chance to grow yet. The blue line is a measurement ruler and shows how far the glacier has retreated from the trees. And the retreat is just getting started. Future years are expected to show an even faster retreat.
(Back to the Taku)
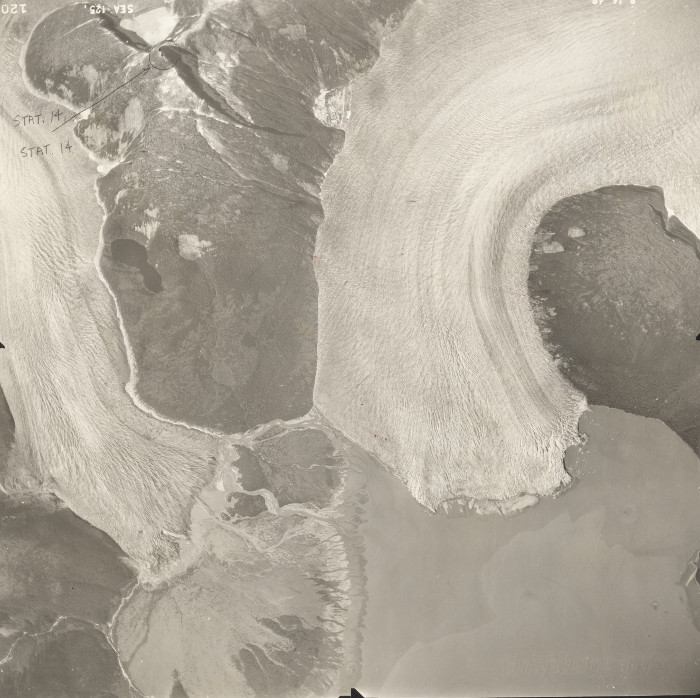
The photograph above is courtesy of the Glacier Photograph Collection at the National
Snow & Ice Data Center. http://nsidc.org/data/glacier_photo/search/
The photograph is an aerial view of the Norris Glacier (left) and the Taku Glacier (right) as of 1948. Up until the 1940s, the terminal (push) moraine in front of the Taku had not grown large enough to appear above sea level; but as of 1948 a muddy silt flat can be seen in front of the center of the Taku Glacier. There is a small area of calving remaining on the right side of the Taku, and this may be the basis of other sources that state that calving continued to 1953. ( For example: https://www.geographie.uni-freiburg.de/publikationen/abstracts/fgh50-en )
By 1948 (at least one source uses a 1953 date - see above) the terminal “push” moraine had grown to the point where there was no ocean water contact with the Taku Glacier. The “snowfall on the glacier = melting + calving” portion of the equation was still out of balance as “calving” had disappeared from the equation. The Taku would continue to grow for decades to come.
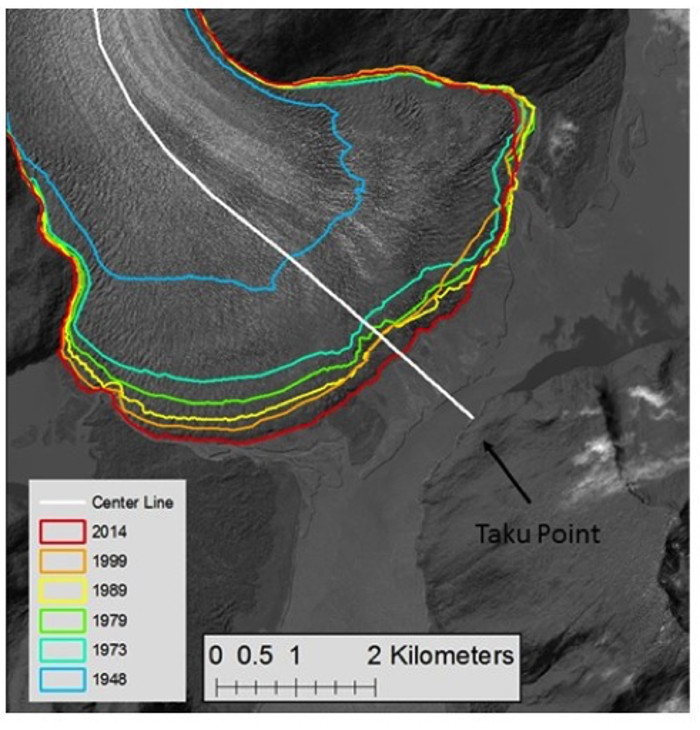
The picture above shows the position of the Terminus of the Taku Glacier from 1948 to 2014. The original picture can be seen at:
http://juneauicefield.com/blog/2016/8/15/taku-glacier-anomaly-of-the-juneau-icefield
As of 1948 the Taku Glacier was still advancing rapidly. The advance slowed after 1973, but still continued up to 2014. As of 2014 it looked like the Taku Glacier had reached the “Extended” stage of the “tidewater glacier cycle” diagram.
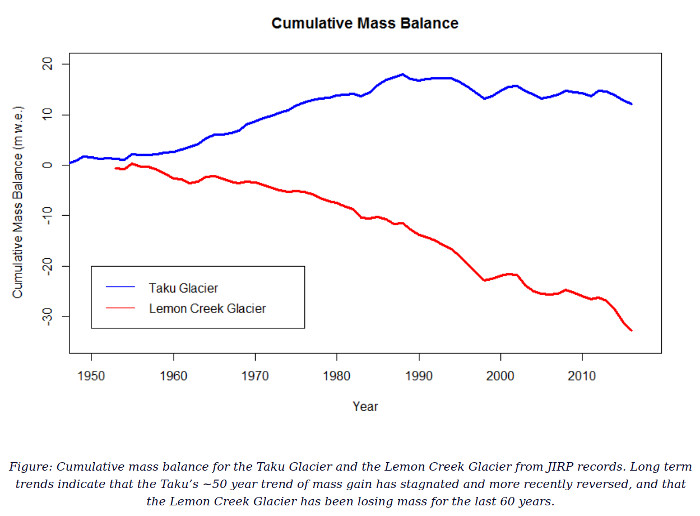
The picture above is a PrintScreen image from the Juneau Icefield Research Program’s blog. http://juneauicefield.com/blog/2017/8/31/the-mass-balance-student-research-project
The mass balance data source for the above chart (up thru 2011) can be seen in Table 1 (page 324) at: https://www.earth-syst-sci-data.net/5/319/2013/essd-5-319-2013.pdf
The picture shows a historical record of the mass balance (total ice volume) of the Taku Glacier as well as the Lemon Creek Glacier (another glacier at the southern end of the Juneau Icefield) as measured by researchers for the Juneau Icefield Research Project.
The mass balance (total ice volume) of the Taku increased from the the first measurements by the JIRP in the 1940s until 1988. This was the period when the Taku’s growing terminal moraine protected it from the melting and calving that had been taking place earlier due to the glacier’s contact with “warm” ocean water.
Additionally, the moraine was a partial barrier to the glacier’s forward advance, and thus ice piled up and thickened behind the moraine. The backup and thickening extended for miles upstream, and this thickening caused the Taku to overflow a low ridge to form the Hole-in-the-Wall Glacier.
After 1988, global warming started to catch up with the Taku. The mass balance (total ice volume) began to shrink. The pressure from the previously accumulated thickness of the ice continued to push the terminus forward even while the middle portion of the glacier began to thin. The process is similar to what happens when you pour syrup on a stack of pancakes. Even after you stop pouring syrup, what you have already poured continues to spread out on your plate while the portion on top of your pancakes thins.
From 1988 on, the total volume of the Taku Glacier began to decrease even though the terminus continued to advance a little more. The thickness in the middle part of glacier started to decrease from the combined forces of “spreading out” plus global warming.
The rate that the Taku’s ice can spread out decreases as the thickness in the middle part of the glacier decreases. Thus the ice supply to try to push the terminus forward will tend to decrease.
Unlike syrup, ice is subject to melting and eventually disappears. Unfortunately for the Taku, the rate of melting continues to increase since the surface area of the glacier subject to melting has increased as well as global warming has increased the melt rate per unit area. Sooner or later, the increase in melting from global warming will overwhelm all parts of the glacier.
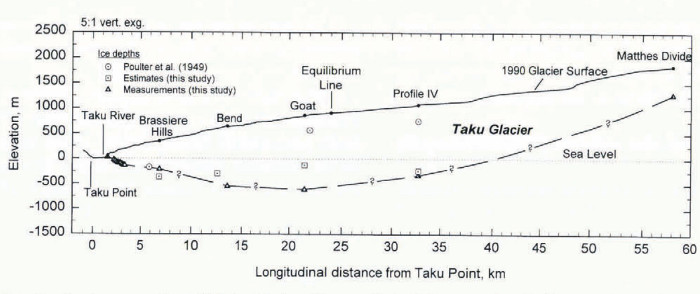
Source for the above diagram is the 1995 paper by Nolan, Motkya, Echelmeyer, and Trabant.
https://www.igsoc.org/journal/41/139/igs_journal_vol41_issue139_pg541-553.pdf
alternately
https://www.cambridge.org/core/journals/journal-of-glaciology/article/icethickness-measurements-of-taku-glacier-alaska-usa-and-their-relevance-to-its-recent-behavior/E0940FCACCBFEB1A8AAFB2D5FF8AB561/core-reader
Please see the source article for information about the sampling points.
The diagram above shows a longitudinal (lengthwise) cross section of the Taku Glacier starting at Taku Point on the left end and extending some 60 km. (37 miles) upstream to Matthes Divide on the right end. The Hole-in-the-Wall Glacier splits off just to the right of the Brassiere Hills label. The top line shows the 1990 surface elevation of the glacier (in meters) above sea level. The bottom line shows the elevation (in meters) of the base of the glacier.
There are several items of interest. First, the base of the glacier is below sea level up to the 40 km. (25 miles) mark. When (not “if”) the Taku Glacier melts, it’s lower portion will be replaced by a 20-mile long lake. (Marine charts show that Taku Inlet is filled in with mud flats up to low tide level for 6 miles below the terminus of the glacier. Thus it will be a lake instead of a fjord connected to the ocean.)
A similar process of a melting glacier forming a long lake is already underway at New Zealand’s Tasman Glacier. (The Tasman Glacier has been retreating at 500 feet per year for the last 30 years. A chart showing the retreat of the Tasman Glacier is shown at the end of the
“5) Why the Taku Glacier is going to start retreating at >= 500 ft. per year”
section at the bottom of this webpage)
Also, the glacier has scoured out another 300 feet of sediments in addition to the 300-foot deep fjord that existed in front of the 1890 terminus. The 300-foot deep area downstream from the 1890 terminus is now ice down to 600 feet below sea level. It’s going to be a very deep lake.
The separation of the two lines in the above diagram shows how thick the Taku Glacier is. At a little upstream from the “Goat” measuring point, the Taku Glacier was some 1477 meters (4,800+ feet) thick as of 1990 making it the thickest known glacier outside the polar icecaps. As the lower end of the Taku starts melting, this thick portion will thin rapidly as ice will ooze rapidly downstream to try to fill in the void. (Eventually this thick portion and everything downstream will end up floating on the growing lake.)
The equilibrium line marks the 1990 position that separated the “accumulation zone” (The right side where more snow falls than melts) from the ablation zone (The left side where more ice melts than snow falls). Since 1990 this equilibrium line has moved higher (moved to the right) due to global warming, and will continue to move higher in the future.
By 2015 the advance of the Taku Glacier had come to a stop.
Juneau Empire
“Taku Glacier's advance stagnates”
https://web.archive.org/web/20151016124409/https://www.juneauempire.com/outdoors/2015-09-04/taku-glaciers-advance-stagnates
Another analytical method for measuring the "health" of a glacier is to measure the accumulation area of a glacier (The portion of a glacier where snowfall is greater than melting) vs. its total area. This is commonly referred to as the Accumulation Area Ratio AAR).
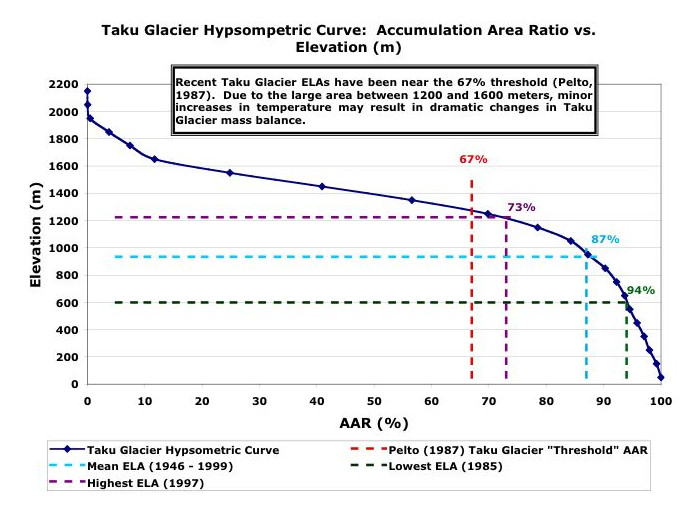
The graph above was published by M.S. Pelto in 2008 and can be seen at http://www.nichols.edu/departments/glacier/taku.html Pelto had previously concluded that glaciers that had an AAR that was significantly less than 67% were shrinking while those that had an AAR significantly greater than 67% were growing. Glaciers that had an average AAR near 67% would be in approximate equilibrium.
There are several items of interest. First, many sources quote an AAR for the Taku Glacier in excess of 80%. Note that this is a very old number and is thus not relevant to current conditions.
2nd: The AAR for the Taku Glacier has been declining for decades. As of the 2008 publishing date (and the research data for this date was already several years old), the AAR for the Taku had already dropped to near the critical 67% ratio.
3rd and most important. Note the statement "Due to the large area between 1200 and 1600 meters, minor increases in temperature may result in dramatic changes in Taku Glacier mass balance." If the ELA (Equilibrium Line Altitude - The line that separates the accumulation zone from the ablation zone) rises above 4,000 ft. (1312 meters), then the AAR will drop below the 67% ratio; and the Taku Glacier will be shrinking.
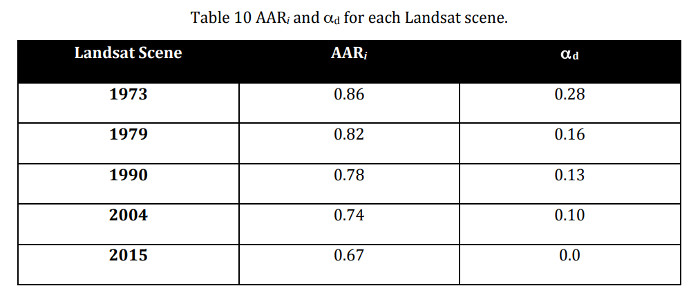
The table above is from "Quantifying Changes in Glacier Thickness and Area Using Remote Sensing and GIS: Taku Glacier System, AK ( https://spatial.usc.edu/wp-content/uploads/2017/11/Hughes-Allen_Lara.pdf ), and updates the AAR for the Taku Glacier up thru 2015. As of 2015, the average AAR for the Taku Glacier had dropped to the critical 67% level. (The last column shows the ratio between the AAR and the critical 0.67 level.)
In June 2017 the author took a sightseeing flight (Wings Airways http://www.wingsairways.com/ ) over the Taku Glacier, and its distributary, the Hole-in-the-Wall Glacier. The author took videos of the Taku and Hole-in-the-Wall Glaciers and posted the result to YouTube.
https://www.youtube.com/watch?v=O5v_Bf3cbHI&feature=youtu.be
The relevant portion of the video begins at 13:07 into the video. As of 2017 it looks like the Taku Glacier has reached the “306 yr” stage of the tidewater glacier cycle diagram. It appears that the retreat of the Taku Glacier has begun.
4) What is happening now to
the Taku Glacier
The following pictures are from the author’s sightseeing flight over the Taku and Hole-in-the-Wall Glaciers in June 2017. Please see the author’s video at https://www.youtube.com/watch?v=O5v_Bf3cbHI&feature=youtu.be – especially the part beginning at 13:07 for more views.
The Hole-in-the-Wall Glacier is part of the Taku Glacier’s distributary system. (Please see the pictures in the “1) The Taku Glacier and its source – the Juneau Icefield” section ) The Hole-in-the-Wall Glacier formed in the 1940s when the Taku thickened enough to flow over a low ridge. Whatever the Taku Glacier does (advance or retreat), the Hole-in-the-Wall Glacier will do the same (and vice versa).
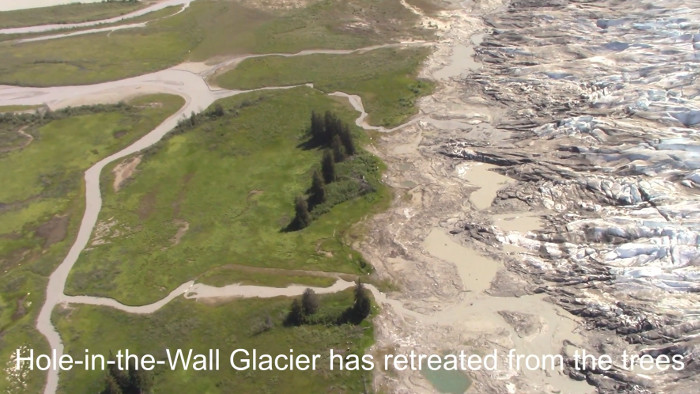
The picture above is a PrintScreen image from the author’s video, and shows the June 2017 position of the terminus of the Hole-in-the Wall Glacier. The view looks southeastward with the small grove of trees centered at about 58.4915 N 133.9877 W. The terminus is retreating from the trees. We can compare the above picture with 2010 and 2006 views as seen via Google Earth.
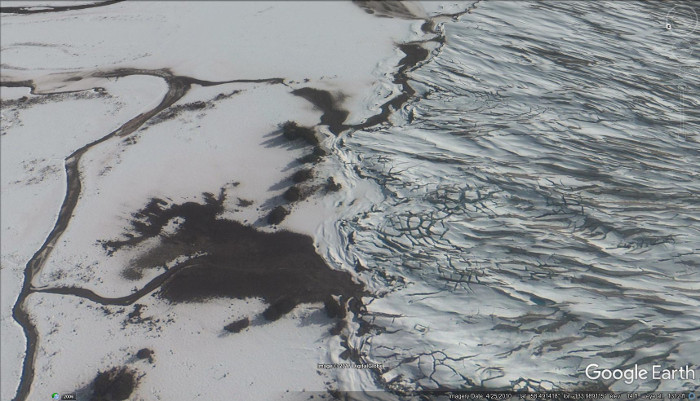
The picture above is a Google Earth view of the same area but as of April 2010. The trees are the same as in the view from the 2017 video. (The Google Earth view has a lot of extra mud, but otherwise the view is approximately the same.)
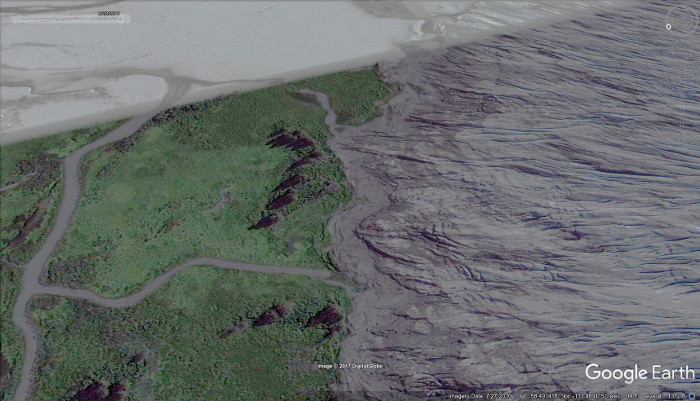
The picture above is a Google Earth view of the same area but as of July 2010. (The bright area is a carryover from April 2010 as it wasn't included in the July 2010 image.)
In 2010 the glacier was threatening to obliterate the trees. But in 2017, the trees are still standing and the terminus is further away. (In the July 2010 Google Earth view, the glacier has retreated a little bit from the trees, but not as far as shown in the June 2017 view.)
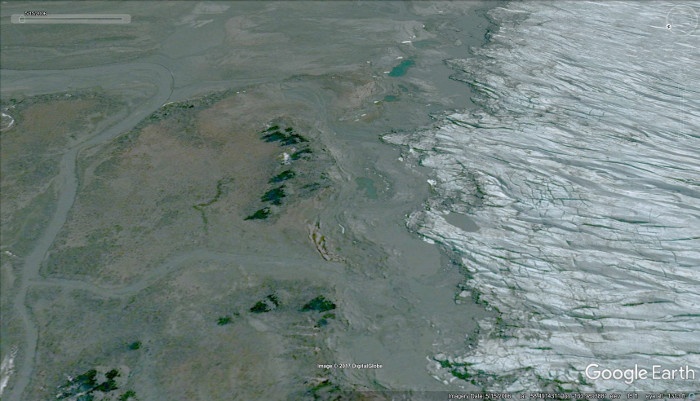
The picture above is a Google Earth view of the terminus of the Hole-in-the-Wall Glacier as of May 2006. The terminus of the glacier is nearly (but not quite) the same distance from the trees as the 2017 picture; but more important, the most advanced terminal moraine was in place before 2006. We can thus deduce the following chronology.
1) The glacier advanced sometime before 2006, and almost reached the trees.Landsat photographs (which have a much lower resolution) suggest that the maximum extent of the Hole-in-the-Wall Glacier occurred about 2003.
2) The glacier retreated by the time the 2006 photograph was taken.
3) The glacier advanced up to 2010, but didn't quite reach the pre-2006 position.
4) The glacier has retreated from 2010 to 2017. (Another aerial photograph by the author on June 24, 2014 shows the terminus near the April 2010 position. Thus most of the recent retreat has been since 2014.)
Thus the glacier's advance has been stalled for at least 11 years - and more likely, since about 2003. Meanwhile, thinning is taking place (see below) on the Taku's surface The thinning will make it very difficult for the glacier to stage any more advances, while at the same time global warming marches onward. The pre-2006 terminal moraine will probably not be challenged again.
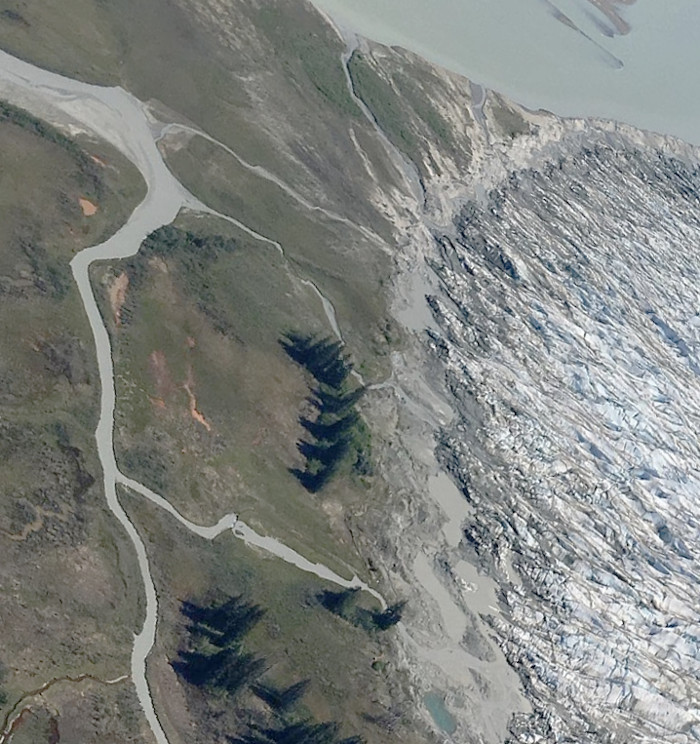
The photograph above shows the terminus of the Hole-in-the-Wall Glacier as of May 2018. (Original photo at https://twitter.com/hashtag/IflewWINGS?src=hash ) The glacier didn't advance over winter 2017/2018, and the whole summer melt season is coming up.
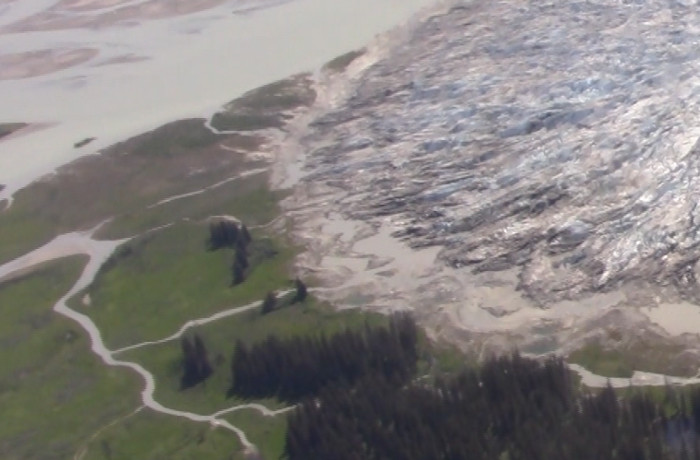
The picture above is the author's June 7, 2019 photograph of the terminus of the Hole-in-the-Wall Glacier. In early June the terminus is at its maximum extent for the season with several months of net melting coming up. Even at this annual maximum extent, the glacier is retreating further from the trees. It seems obvious that the Hole-in-the-Wall/Taku Glacier system has recorded its maximum extent, and is now going into rapid retreat.
Lower resolution Landsat (satellite) photographs show that as of Sept. 10, 2019 the closest glacial ice is now more than 600 feet from these marker trees. Also please see NASA's Earth Observatory at https://earthobservatory.nasa.gov/images/145830/retreat-begins-at-taku-glacier for a direct comparison of the Taku and Hole-in-the-Wall glaciers in 2014 and 2019.
Logically, the Hole-in-the-Wall's terminus should retreat before the Taku's terminus retreats since the Hole-in-the-Wall Glacier suffers a greater percentage decline in its ice supply for any given thinning of the Taku (See below). (Remember, the ice supply for the Hole-in-the-Wall still has to climb over the old buried ridge.)
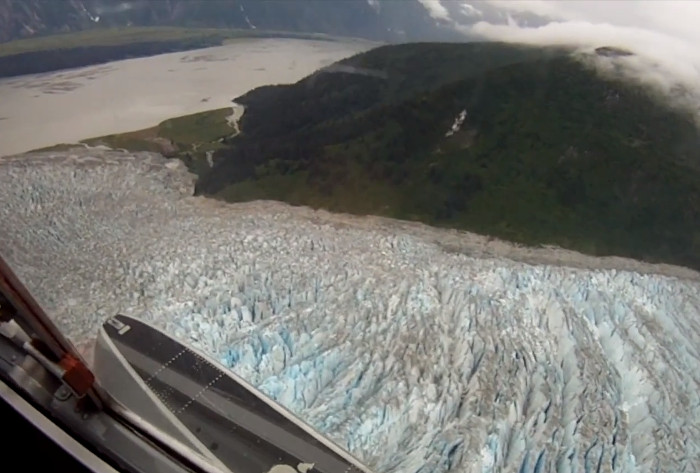
The photograph above is a PrintScreen excerpt from a video by Wings Airways https://www.youtube.com/watch?v=7hXqBE-hz90 , and shows the southeast edge of the Hole-in-the-Wall Glacier. The estimated date of the photo is about late June to early July 2017.
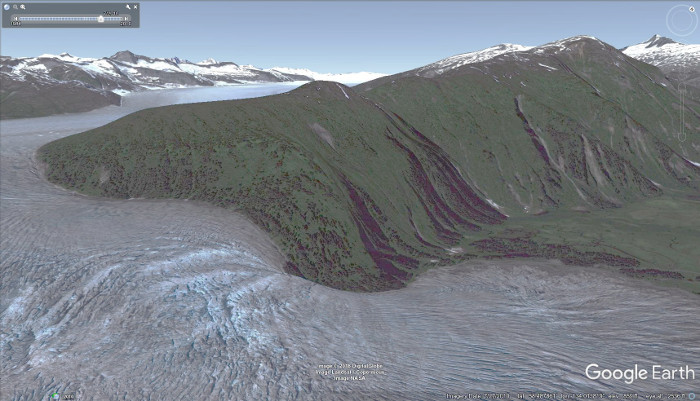
The picture above is a Google Earth view of the northwest side of the Hole-in-the-Wall Glacier as of July 2010.
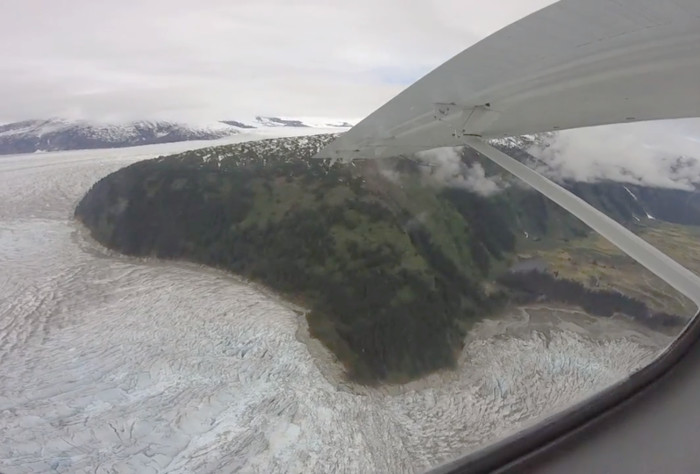
The picture above is a PrintScreen image from a video posted at https://www.youtube.com/watch?v=dCogbOjAtTM&t=3s , and shows what the same area looked like about June 1, 2018. The lower left quadrant shows a trimline where the glacier has retreated from the trees.
In the lower right quadrant, the glacier has retreated from its 2010 position near the trees to reveal an expanse of sand and mud.
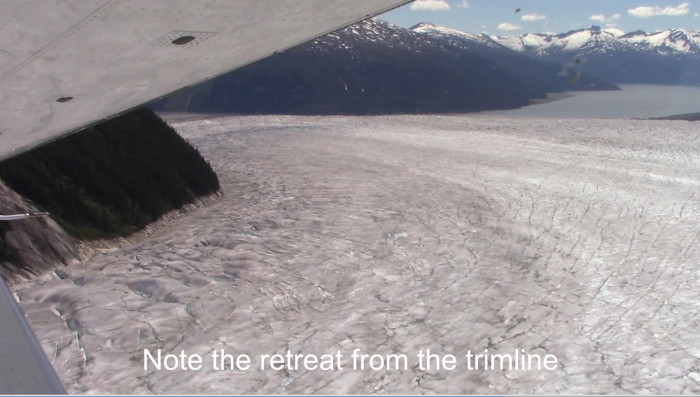
The picture above is a PrintScreen frame from the author’s video which can be seen at https://www.youtube.com/watch?v=O5v_Bf3cbHI&feature=youtu.be The sightseeing flight is over the Taku Glacier. Taku Inlet can be seen in the upper right. The mountain in the left foreground is the Brassiere Hills ridge between the Hole-in-the-Wall Glacier and the Taku Glacier.
When a glacier is growing, it obliterates any vegetation in its path. When a growing glacier thickens, it obliterates any vegetation in its path along the side walls of its valley.
On the left side of the picture there is a sliver of rock between the glacier and the trees. When the Taku Glacier was growing and thickening, it “trimmed” all vegetation that was in its path. The line marked by trees on top and rock underneath is a “trimline” It is a record of how thick the glacier was when it was at its thickest.
The bare rock is a zone where the glacier has removed everything except the solid rock. In order to see the bare rock area, the Taku Glacier had to thin. The area in the photograph is more than 2 miles upstream from the glacier’s terminus. The Taku Glacier is melting and thinning 2 miles upstream from its terminus. This is telling us what will happen downstream at the terminus a few years in the future. The Taku Glacier has started its retreat.
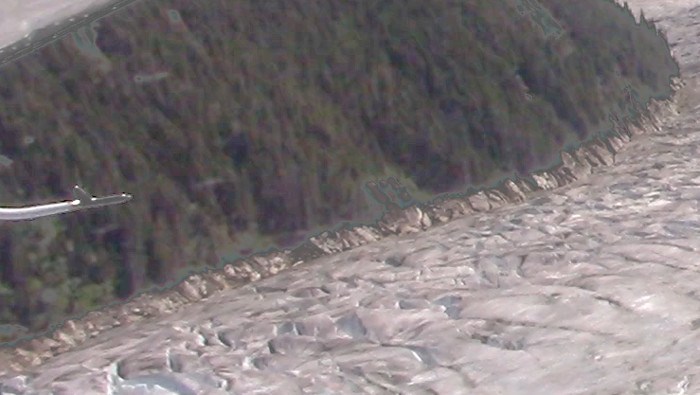
The trimline is perhaps the best available clue for letting us know whether the Taku is in an advancing or retreating mode. The picture above is digitally enhanced portion of a frame from the original video.
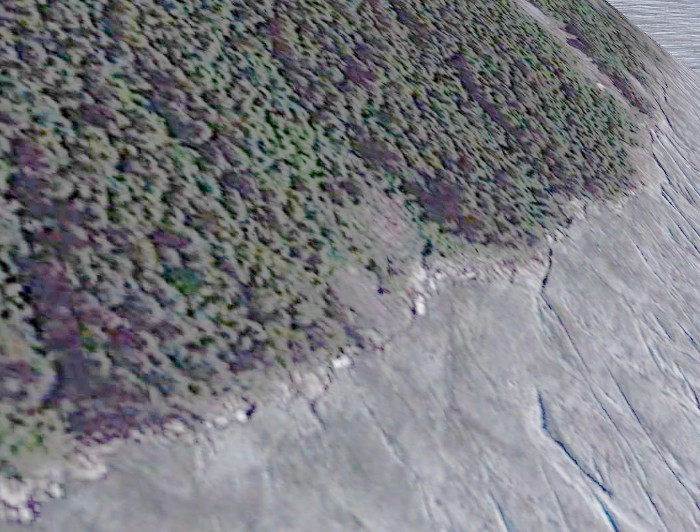
The picture above is a Google Earth view that contains approximately the same field of view but as of July 2010. (The flat rocks just above the trimline near the center of both pictures can be used as a reference guide.) The glacier had apparently reached its maximum thickness slightly before July 2010, but the thinning as of 2010 was no where near as much as that shown in the 2017 view.
This thinning of the glacier is extremely important. The thinning is more than a few inches. It’s not easy to get an accurate measurement of the amount of thinning as viewed from an airplane, but the trees in the background should give some idea of the scale.
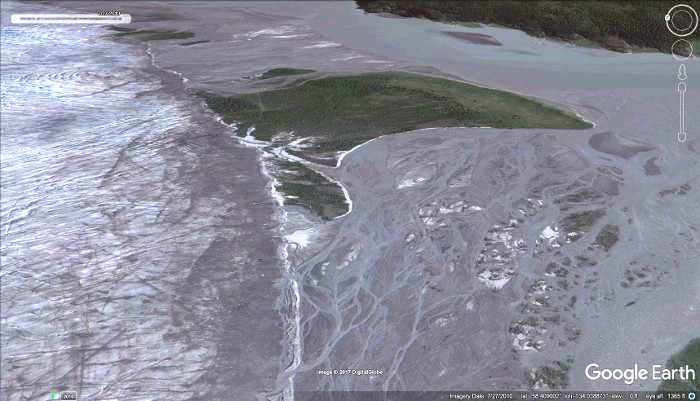
The picture above is a Google Earth view of the terminus of the Taku Glacier as of July 2010.
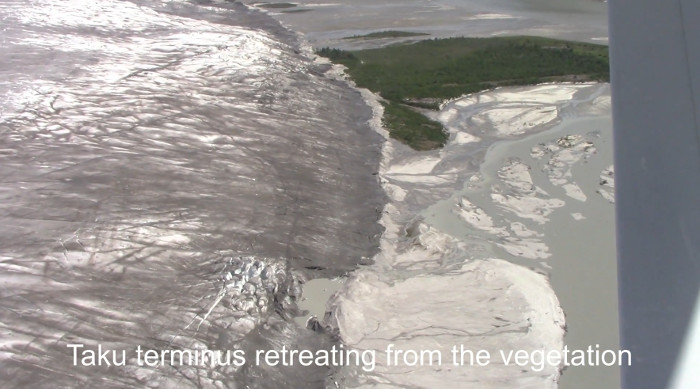
The picture above shows approximately the same area of the terminus of the Taku Glacier, but as of June 2017.
There are two items of interest.
1) The terminus of the Taku Glacier has retreated from 2010 to 2017. The maximum extent was probably greatest about 2014 (+/-) The July 2010 Google Earth view doesn’t show any retreat yet. By June 2017 there is a noticeable gap between the glacier and the untouched vegetation.
2) In the 2017 picture there is a small innocuous-looking melt-water pond next to the glacier in the foreground of the picture. This small pond (and what will follow) is a source of water that can tunnel its way underneath and start melting the glacier from the bottom up. Water is at its densest at about 39 deg. F. Water at 39 deg. F. will sink below water at any other temperature; and of course, water at any temperature will sink below ice if it has any possible way of doing so. 39 deg. F. water is not warm enough to encourage swimmers, but it is warm enough to melt ice.
Ice immediately to the left of the "small pond" shows crevasses. There is also a crevasse that extends toward the left foreground from this local area of crevasses. This implies that the pond extends further to the left under the ice, and part of the Taku Glacier is sinking into this extension of the "pond".
Glaciers are full of cracks and crevices, and water will find any available opening to sink downward as water is denser than ice. In the tidewater glacier cycle diagram, the “306 yr” diagram shows a “Void opening”. The innocuous-looking meltwater pond in the 2017 view is the start of a “Void opening”, and marks the start of the collapse of the Taku Glacier. And the innocuous-looking meltwater pond (or something similar to follow) may very well be the start of what will become a 20-mile (+/-) long lake.
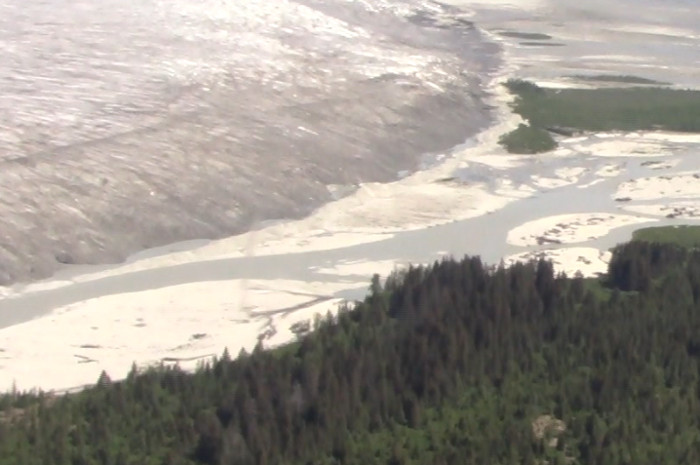
The photo above updates the terminus of the Taku Glacier as of June 7, 2019. The date is earlier in the season than the 2017 photo, but the glacier is already further back from the vegetation, and the summer melt season is just beginning.
Thinning by the Taku
Glacier next to the Norris River
The following 3 pictures illustrate thinning by the Taku Glacier in its calving zone next to the Norris River.
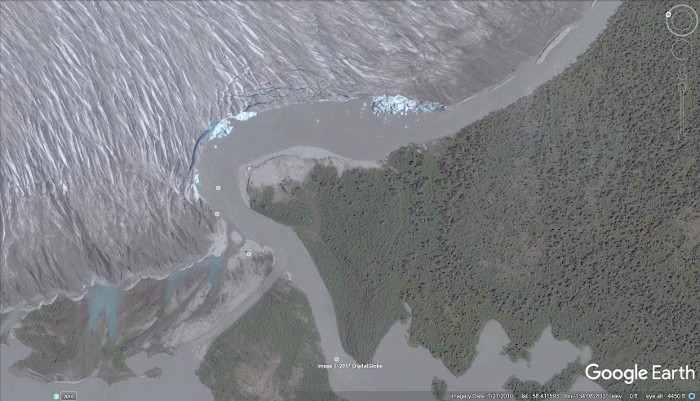
The picture above is a 2010 Google Earth view of the Taku Glacier (above & left) where the southwestern part of the Taku's terminus calves into the river emanating from Norris Glacier/Lake (off lower edge). In this 2010 view, the southwestern part of the Taku's terminus was in its final phase of advance into the river with the river trying to melt/undercut the leading edge of the glacier. The steep cliff face of the Taku is not visible in the vertical Google Earth view, but several areas of recent calving can be seen where the river's undercutting had caused portions of the ice-cliff face to collapse.
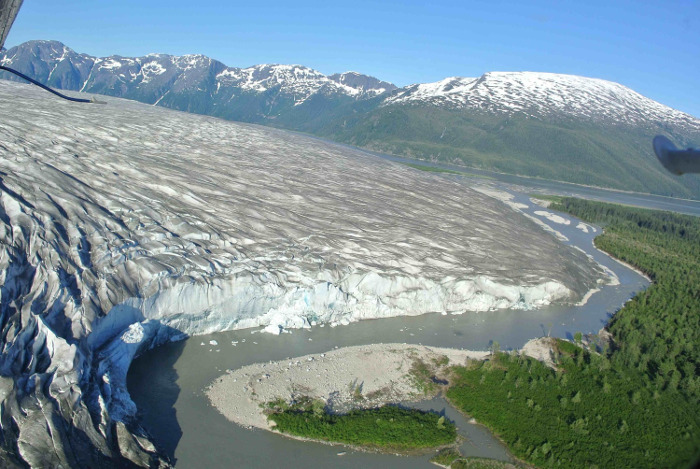
The photograph above was taken by Salvatore G. Candela and posted in 2013 on the Juneau Icefield Research Project's blog at: http://juneauicefield.com/blog/?offset=1374969977763 The terminus of the Taku Glacier covers the same area as seen in the Google Earth picture, but the view direction is oriented from the lower left up toward the upper right of the Google earth view.
The Taku is near its maximum extent, and probably is right at its maximum thickness. Note that the ice cliff is near vertical at the river's bend in the foreground, with the cliff extending along much of the far side of the river. Fresh ice is seen on the cliff which indicates calving is still taking place.
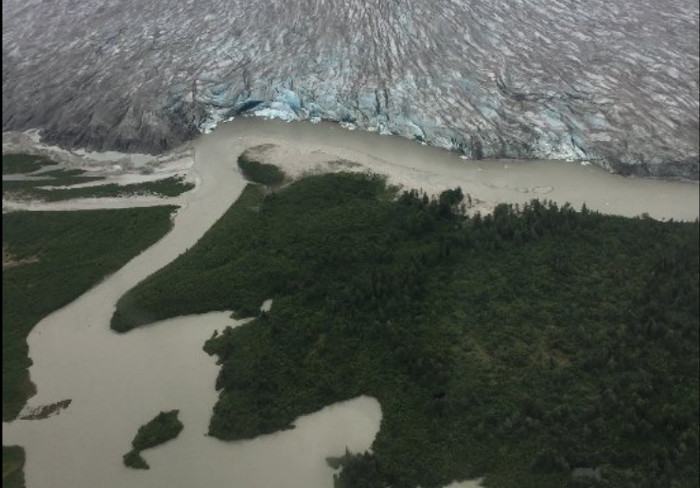
The photograph above was taken by "Barry L" and submitted to TripAdvisor in 2017. https://www.tripadvisor.com/ShowUserReviews-g31020-d1157465-r521227995-Taku_Glacier_Lodge_Wings_Airways-Juneau_Alaska.html#REVIEWS Presumably, the photograph was taken shortly before the July 2017 date. This time, as measured by the Google Earth picture, the view was from the lower right to the upper left.
In the interval from the 2013 photograph to the above 2017 photograph, the Taku has thinned and probably not tried to push forward much. Except for a small area at the bend in the river, the rest of the Taku's ice front does not show a fresh ice cliff. Instead the dirty, debris covered surface of the glacier forms a steep (but not a cliff) face down to the river's edge. The ice cliff that had exposed fresh ice due to calving has been replaced by nearly stagnant ice that is simply being melted away.
There is still another clue when we compare the two photographs. In the 2013 photograph there is no vegetation on the outermost (leftmost) tip of the gravel bar on the shore across the river from the glacier. When large chunks of ice used to calve off the Taku they produced large waves and water surges that washed up on the shore. The large beach waves continually reworked the sand/gravel next to the river so that vegetation didn't have a chance to take root.
In the 2017 photograph there are patches of green vegetation at the leftmost tip of the gravel bar. Given that vegetation has taken root, it means that there have been few, if any, large waves that have reworked the gravel. Few, if any, large waves means little if any calving. A lack of calving means the Taku Glacier isn't pushing forward anymore.
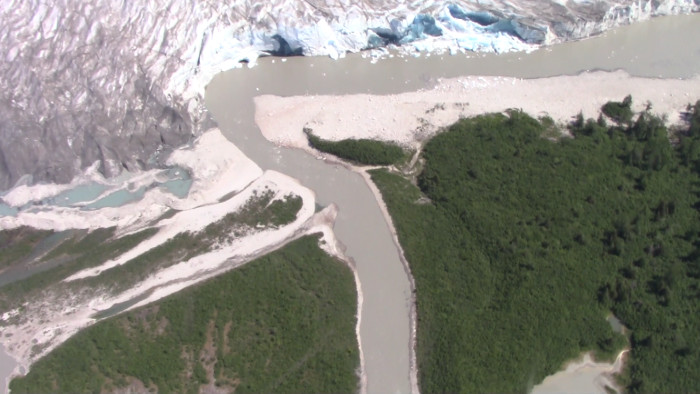
The photo above was taken by the author and shows the same area, but as of June 7, 2019. Note the retreat/thinning of the glacier to the left of the sharp right turn of the Norris River. Also, at the top of the photo, the Norris River has moved further away from the vegetated shoreline. The retreat of the Taku Glacier has started.
Evidence of thinning on the upper reaches
of the Taku Glacier
Subsequent to the initial posting of this web page in Sept. 2017, additional evidence has become available showing thinning on the upper portion of the Taku Glacier as well as thinning on the major tributaries of the Taku. The following picture is a photograph of a poster prepared by Ann Hill of Skidmore College who spent summer 2017 doing research work with the Juneau Icefield Research Project. The poster was posted Dec.12, 2017 on the American Geophysical Union's Blogosphere. https://blogs.agu.org/fromaglaciersperspective/2017/12/12/glaciologists-perspective-agu-day-2/
(Click on image for a large version which also shows thinning on the major tributaries to the Taku Glacier.)
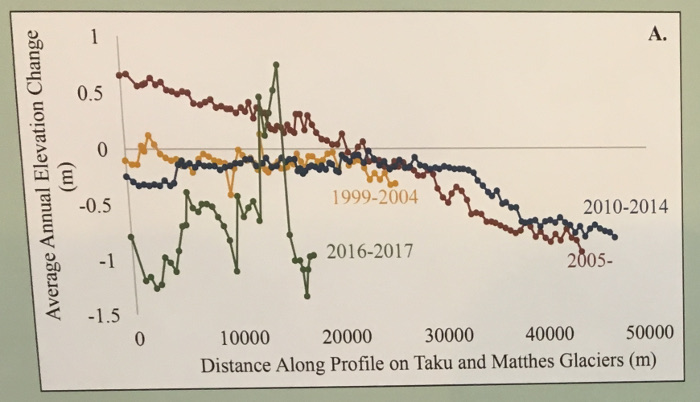
The diagram above is a photograph of part of a poster for the Taku Glacier. The lines on the chart show the rate of thinning of the glacier's surface over the time period from 1999 to 2017 for a longitudinal center section of the glacier from its terminus (left side of diagram) to its upper end on the Canadian border (right side of the diagram). While the previous photographs showed thinning near the lower end of the Taku Glacier, the chart above shows the rate of elevation change (as measured by precise GPS systems) over the entire length of the glacier.
Thinning over the highest part of the glacier since 2010 is of particular interest. (Right portion of the blue line)
The Hubbard Glacier
The Taku Glacier isn't the only Alaskan tidewater glacier that was formerly advancing, but apparently has recently gone into retreat. One of the standard stops for cruise ships is to visit the Hubbard Glacier. (Near the northern end of the Alaskan panhandle.)
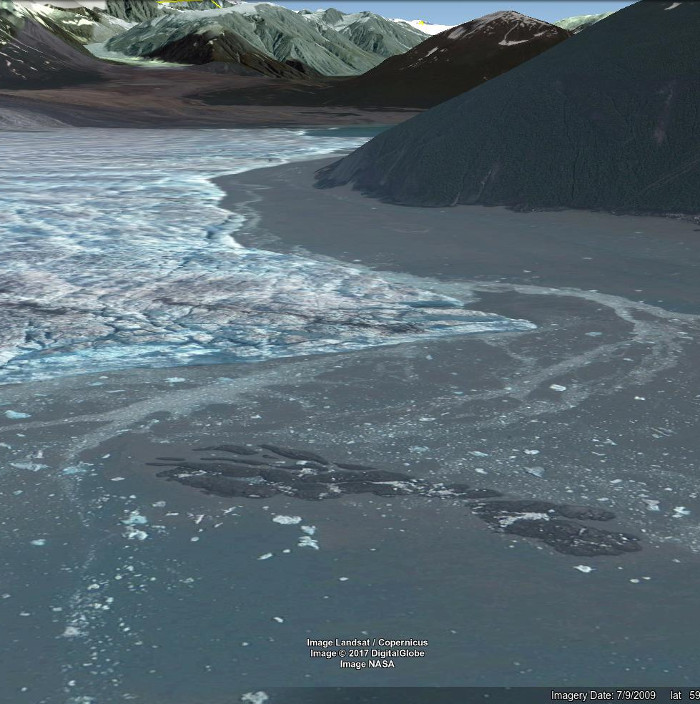
The picture above is a 2009 Google Earth view showing a mud flat/terminal moraine in the foreground, the terminus of the Hubbard Glacier in the upper left and Gilbert Point in the upper right. Russell Fjord is out of sight behind Gilbert Point.
In 1986 and again in 2002, with the help of surges by its tributary the Valerie Glacier, the Hubbard Glacier briefly closed the gap between it and Gilbert Point - thus briefly turning the fjord into a glacially damned lake. Both times the rising water level in Russell Fjord was able to break through the temporary dam. Since 2002, the entrance to Russell Fjord has remained open.
In the 2009 picture above, if you were to take a small boat from the lower left corner of the picture to reach Russell Fjord, you would have to zigzag to the left around the mud flat, then zigzag to the right around the extreme right end of the glacier, then zigzag to the left through the narrow channel around Gilbert Point, and finally turn right again before you could enter Russell Fjord.
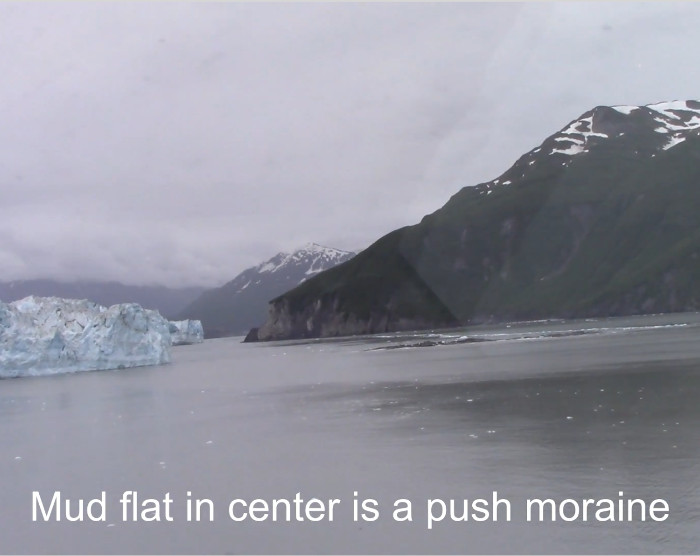
The photograph above (From the author's video at https://www.youtube.com/watch?v=h9OvSStqxVg ) shows the entrance to Russell Fjord as of June 29, 2017.
The Hubbard Glacier has retreated to the point where a small boat could take a direct path straight into Russell Fjord. Note that the mud flat is to the right of center.
The Hubbard Glacier's retreat has opened a gap that allows "warm" ocean water to have direct access to the glacier's calving front. (See the "310 yr" panel in the tidewater glacier diagram shown earlier.) While there is still a chance that another temporary surge by the Valerie Glacier could put a "speed bump" in the retreat phase, an accelerating retreat by the Hubbard Glacier appears more likely.
5) Why the Taku Glacier is
going to start
retreating at >= 500 ft. per year
retreating at >= 500 ft. per year
In part 2), we looked at the tidewater glacier cycle. Even if nothing else changed, a tidewater glacier retreats rapidly once retreat sets in. This is because the lake (or ocean) in front of the glacier melts both the front end and underneath part of the glacier.
In turn, if we look at the basic equation for glacial balance (Snowfall = melting + calving), once a tidewater glacier starts melting back, it will start calving rapidly. Thus the ablation side of the equation becomes larger, and the glacier retreats.
Global warming will also hit the “snowfall” side of the equation. We saw earlier that large portions of the Taku Glacier are at relatively low elevations. As global warming continues to progress, precipitation over large portions of the glacier will change from predominately snow to predominately rain.
We can apply all of these changes to the complete equation for a glacier's budget.
The complete equation is:
Glacier growth = snowfall
on the glacier - melting - calving
The changes that will be taking place are:
Snowfall on the glacier - Decreasing as global warming changes snowfall to rainfall
Melting - Increasing as air temperatures warm and a lake melts the ice
Calving - Increasing as the front end of the glacier calves into the lake
Any one of the above will force "glacier growth" to become negative. The combination of all three will force "glacier growth" to become strongly negative.
In regard to the estimate that the Taku Glacier will retreat at 500 (or more) feet per year, we only have to look at what has happened in the past.

The diagram above is the same diagram that we looked at earlier when were looking at where the terminus of the Taku Glacier has been over the last 300 years. The lowest part of the graph tells us how fast the Taku was advancing or retreating during this 300 year interval. If we look at the portion from 1750 to 1794 (From Lawrence's trimline analysis to Vancouver's visit), the Taku retreated at some 170 meters (550+ feet) per year. The climate has warmed significantly since the 1700s, and will continue to warm in the future. The 500 feet per year retreat rate may be overly conservative.
The first few years of retreat for the Taku will be relatively slow – less than 100 feet of retreat per year. Once a lake starts to appear behind the terminal moraine, the retreat rate will pick up. In 30 to at most 40 years, this retreat will accelerate to 500 or more feet per year as serious calving begins.
New Zealand's Tasman Glacier
is a model
for what is expected to happen to the Taku
for what is expected to happen to the Taku
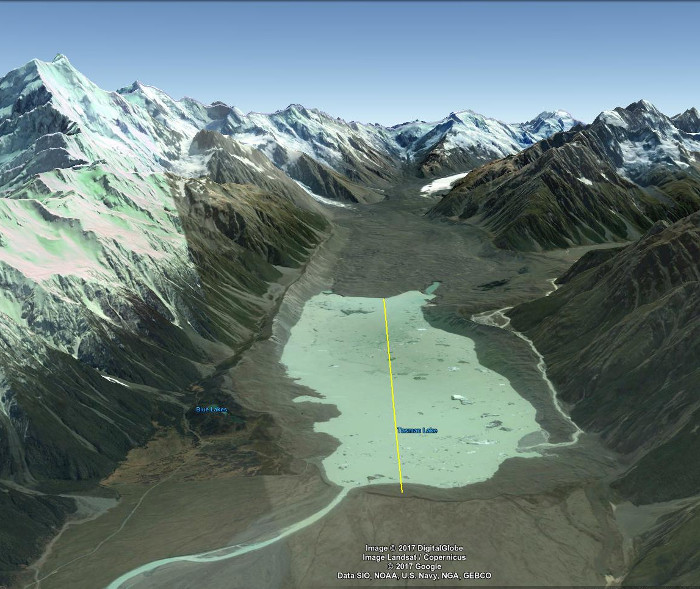
The picture above is a 2013 Google Earth view of New Zealand's Tasman Glacier and Tasman Lake. The debris covered lower portion of the glacier extends from the far side of the lake back toward the distant mountains before it bends to the right and disappears out of sight. The high mountain to the left is Mt. Cook. The yellow "ruler" that runs across the lake is over 3 miles long and measures the retreat of the terminus of the glacier since it started backing off from its terminal moraine in the 1970s.
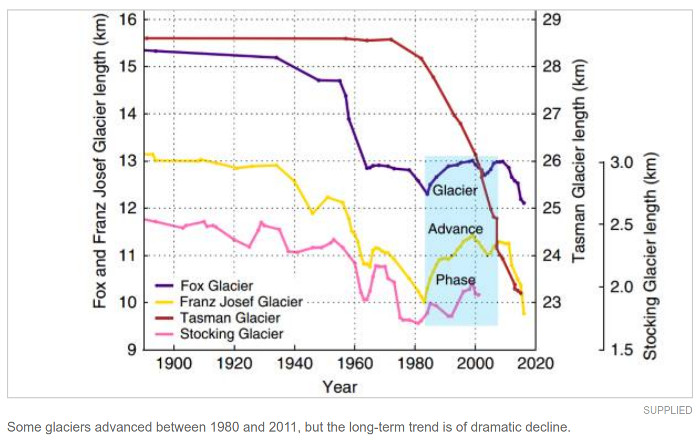
The chart above is from
http://www.stuff.co.nz/environment/89403443/When-the-worlds-glaciers-shrunk-New-Zealands-grew-bigger
and shows the retreat of several of New Zealand's glaciers - including the Tasman. (Original source was in Nature: https://www.nature.com/articles/ncomms14202#f2 ) The terminal position of the Tasman Glacier (dark red line) is a model for what is expected to happen to the Taku Glacier.
From the late 1800s to the early 1970s, the Tasman Glacier was steadily pinned to its terminal moraine (near side of the lake). As the Tasman began to slowly retreat in the late 1970s, a growing, 800 foot deep “proglacial” lake began to form between the glacier's terminus and the old terminal moraine. From the mid 1980s on, the Tasman Glacier has been calving icebergs into the lake. (For example, the distant iceberg to the left of the top of the yellow line is about 1,200 feet long.)
A schematic model for past
growth and future retreat of the Taku Glacier
The diagram below is a schematic model showing past growth and expected future decline for the Taku Glacier. Input for the model is simply dimensionless annual estimates for the Glacier Growth equation = Snowfall on the glacier - Melting - Calving.
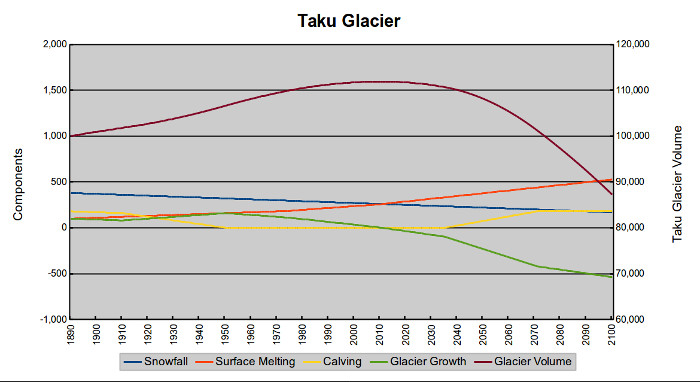
In the above diagram:
Snowfall on the glacier is dark blue. Scale for snowfall is the left axis. Decreases linearly from 380/year in 1890 to 170/year in 2100. (At middle elevations precipitation gradually changes from predominately snow to predominately rain. As the glacier thins, decreasing surface height is also a factor. Snowfall would decrease faster except total precipitation increases, and high elevations still get a lot of snow.)
Glacier Surface Melting is red. Scale for melting is the left axis. Starts at 100 in 1890. Increases at 1/year thru 1974, then 2/year thru 2009, then 3/year thru 2100. Slow acceleration due to Global Warming. (Toward 2100, the melting rate per unit area will increase further, but this is offset because the glacier's area is noticeably decreasing.)
Calving is yellow. Scale for calving is the left axis. Starts at 180 in 1890. Decreases at 1/year thru 1910 (Slow buildup of subsurface terminal moraine). Faster decrease of 4/year starting in 1911 until there is no calving in 1950. Calving begins again in 2036 and increases at 5/year until steady rate of 180/year beginning in 2071. (Includes subsurface melting late in model years as lower portion of glacier begins to float in a growing lake.)
Glacier Growth is green. Scale is the left axis. Glacier Growth = Snowfall - melting - calving. Becomes negative about 2011, with rapidly increasing negative growth as calving returns.
Glacier Volume is purple. Scale is the right axis. Starts at an arbitrary large number with annual changes equal to values for Glacier Growth.
100 years ago there was a deep fjord suitable for ocean-going ships in front of the Taku. This was subsequently filled in with ice. A few decades from now the fjord will become a deep lake with a rapidly calving (and retreating) glacier at the other end.
200 years from now, if you travel to visit the Taku Glacier, you will instead find a large lake (about 20 miles long). There will still be much smaller glaciers in the higher mountains, but most of what is now the Juneau Icefield will have become lakes and newborn forests.
Also please see:
Journal of Glaciology
Cambridge University
Modeling the evolution of the Juneau Iceeld between 1971 and 2100 using the Parallel Ice Sheet Model (PISM)
https://www.cambridge.org/core/journals/journal-of-glaciology/article/modeling-the-evolution-of-the-juneau-icefield-between-1971-and-2100-using-the-parallel-ice-sheet-model-pism/2C4BDB97E102DC3C1E684A477E7AA6D5.
"Using the WRF data forced with the RCP6.0 emission scenario, the model projects a decrease in ice volume by 58–68% and a 57–63% area loss by 2099 compared with 2010. If the modeled 2070–99 climate is held constant beyond 2099, the icefield is eliminated by 2200."
Taku Glacier, Alaska Retreat Begins: A Two Century Long Advance Reversed by Climate Change
Oct. 9, 2019
https://blogs.agu.org/fromaglaciersperspective/2019/10/09/taku-glacier-alaska-retreat-begins-a-two-century-long-advance-reversed-by-climate-change/
NASA Visible Earth
Retreat Begins at Taku Glacier
Nov. 4, 2019
https://visibleearth.nasa.gov/images/145830/retreat-begins-at-taku-glacier
The author’s aerial videos of the Taku and Hole-in-the-Wall glaciers at:
2014: https://www.youtube.com/watch?v=AX2SbHgaofs&feature=youtu.be
2017: https://www.youtube.com/watch?v=O5v_Bf3cbHI&feature=youtu.be
2019: https://www.youtube.com/watch?v=_gvN5qPa_9U&feature=youtu.be
Finally, please see:
Alaska’s Melting Glaciers: http://durangobill.com/MeltingAlaska/MeltingAlaska.html
Return to Durango Bill's Home page
Web page generated via Sea Monkey's Composer HTML editor
within a Linux Cinnamon Mint 18 operating system.
(Goodbye Microsoft)
